. 2012 Sep;192(1):173-83.
doi: 10.1534/genetics.112.140798. Epub 2012 Jun 19.

Three routes to suppression of the neurodegenerative phenotypes caused by kinesin heavy chain mutations

Affiliations

Three routes to suppression of the neurodegenerative phenotypes caused by kinesin heavy chain mutations

Inna Djagaeva et al. Genetics. 2012 Sep.

Abstract

Kinesin-1 is a motor protein that moves stepwise along microtubules by employing dimerized kinesin heavy chain (Khc) subunits that alternate cycles of microtubule binding, conformational change, and ATP hydrolysis. Mutations in the Drosophila Khc gene are known to cause distal paralysis and lethality preceded by the occurrence of dystrophic axon terminals, reduced axonal transport, organelle-filled axonal swellings, and impaired action potential propagation. Mutations in the equivalent human gene, Kif5A, result in similar problems that cause hereditary spastic paraplegia (HSP) and Charcot-Marie-Tooth type 2 (CMT2) distal neuropathies. By comparing the phenotypes and the complementation behaviors of a large set of Khc missense alleles, including one that is identical to a human Kif5A HSP allele, we identified three routes to suppression of Khc phenotypes: nutrient restriction, genetic background manipulation, and a remarkable intramolecular complementation between mutations known or likely to cause reciprocal changes in the rate of microtubule-stimulated ADP release by kinesin-1. Our results reveal the value of large-scale complementation analysis for gaining insight into protein structure-function relationships in vivo and point to possible paths for suppressing symptoms of HSP and related distal neuropathies.


Figures

Figure 1
Figure 1
Locations of Drosophila Khc and human Kif5A amino acid codon changes. The colored ovals show accurate positions of mutant changes relative to aligned amino acid sequences (Figure S1). The mechanochemical head and the globular tail regions of Khc are orange rectangles. Coiled-coil forming elements of the α-7 neck helix-hinge 1 (N–H) and the stalk are striated rectangles. Intervening flexible regions are single lines. Landmark structural features that have clusters of mutations are noted with arrows: Sw1 (switch 1), L11 (loop 11), L12 (loop 12), and IAK (QIAKPIRS conserved tail peptide). The red asterisks mark fly Khc74 and a human HSP allele that causes the same D79N amino acid change in α-helix 1 (numbering from SwissProt accession nos.: Q12840 for Kif5A and P17210 for Khc). The blue triangle represents an in-frame deletion that removes three amino acids from a human HSP allele.
Figure 2
Figure 2
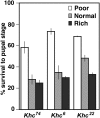
Restricted nutrition delays Khc74, 6, and 22 lethality. Sets of 20 first instar Khcmutant/Khc27 larvae were cultured on either apple juice agar medium (poor), corn meal/corn syrup/killed yeast medium (normal), or normal medium supplemented with live yeast (rich). The number of animals that survived to the pupal stage was recorded for at least three tests of each genotype and culture condition. Bars show averages with variances displayed as standard error (n ≥ 3 sets of larvae).
Figure 3
Figure 3
Axonal transport effects of Khc missense alleles. Larvae bearing the indicated Khc alleles over a null (Khc27) with mito-GFP or ANF-GFP expressed in neurons were anesthetized and fluorescent organelles were observed in segmental nerves by time-lapse microscopy. The number of mitochondria or dense core vesicles (DCV) that moved anterograde or retrograde past a line across one segmental nerve per larva was counted for at least three animals of each genotype. Bars show averages of those values normalized to wild-type mitochondria or DCV flux values (1.8/min and 35.7/min, respectively, n = 5 and 10 larvae, respectively). Variance is displayed as standard error. Instances of no mitochondria seen moving are reflected by a 0. Instances of no mitochondria present in the segmental nerve region analyzed are reflected by an X. Black bars (viability) show the average percent viability for each allele in complementation tests with all other alleles (see Avg marginal values in Figure 4A). The locations of mutant amino acid codon changes relative to the three major structural regions of Khc and to loop 11 are shown below the X-axis.
Figure 4
Figure 4
Intra-allelic complementation between Khc missense alleles. Lethal complementation tests were done by mating 24 Khc missense alleles in all possible nonself combinations. (A) Alleles from females are listed across the top and those from males are listed on the left side arranged by the positions of their codon changes in the sequence of Khc (N-terminal at upper left). The gray lines reflect boundaries for structural regions as illustrated on the right and bottom of B. Each cell in the body of the table shows results from mating KhcalleleM/Khc+ with KhcalleleF/Khc+, where Khc+ was carried on a CyO balancer chromosome that had recessive lethal and dominant visible marker mutations. The cell values reflect percent viability; the number of KhcalleleM/KhcalleleF progeny from each cross that developed to the adult stage divided by one-half the number of heterozygous CyO progeny times 100%. Sample sizes for each cross ranged from 100 to 1000 total progeny. Marginal values (Avg) show the average percent viability for each female or male allele in all its crosses (excluding the calculated self-cross value). (B) Results of a contingency analysis that used the average values from A for each female and male allele to calculate expected values for each cell. The magnitudes of differences between observed and expected values are shown as standardized residuals ([observed-expected]/[expected]1/2). The self-cross values in A (shaded gray) represent expected values derived from the contingency table by trial and error to produce residuals of zero; in essence rendering their contingency contributions neutral (shaded black in B). This was necessary because chromosomes with Khc mutations often carried secondary recessive lethals that affected viability results in homozygotes. Cells showing negative interactions between Khc alleles are shaded light red for residuals between −2 and −5 and dark red for more negative residuals. Cells showing positive interactions are shaded light green for residuals between 2 and 5 and dark green for more positive residuals. (C) A 5 × 5 matrix shows contingency analysis of viability values aggregated within the five Khc structural regions shown in A and B. Note the remarkably negative values for crosses between alleles in loop 11 and the positive values for crosses between loop 11 and the tail. (D) A 4 × 4 contingency analysis of viability values aggregated according to four different genetic backgrounds, one from each mutagenesis effort that generated the Khc alleles (see Materials and Methods). Note that crosses within each mutagenesis group had more negative effects on viability than crosses between groups, indicating parental chromosome recessive genetic background effects on Khc mutant lethality.
Figure 5
Figure 5
Model of the Drosophila Khc head highlighting loop 11 and α-helix 4. The microtubule binding surface is closest to the viewer. Upon binding a microtubule, α-helix 4 (α-4) lengthens by recruiting 10 adjacent amino acids from loop 11 (L-11) extending to G242 (orange star). That dynamic change is thought to shift switch II (black star) near the beginning of loop 11 to facilitate ADP release (Sindelar 2011). This model was developed using a Monte Carlo algorithm with Rosetta starting with coordinates for the human Khc head from Kull et al. (1996), and substituting in Drosophila sequence. This folding pattern represents the most common low energy state from 5000 different tertiary structure predictions.

Similar articles

Cited by

References

    1. Akhmanova A., Hammer J. A., 3rd, 2010. Linking molecular motors to membrane cargo. Curr. Opin. Cell Biol. 22: 479–487 - PMC - PubMed
    1. Auerbach S. D., Johnson K. A., 2005. Kinetic effects of kinesin switch I and switch II mutations. J. Biol. Chem. 280: 37061–37068 - PubMed
    1. Barkus R. V., Klyachko O., Horiuchi D., Dickson B. J., Saxton W. M., 2008. Identification of an axonal kinesin-3 motor for fast anterograde vesicle transport that facilitates retrograde transport of neuropeptides. Mol. Biol. Cell 19: 274–283 - PMC - PubMed
    1. Blackstone C., O’Kane C. J., Reid E., 2011. Hereditary spastic paraplegias: membrane traffic and the motor pathway. Nat. Rev. Neurosci. 12: 31–42 - PMC - PubMed
    1. Blair M. A., Ma S., Hedera P., 2006. Mutation in KIF5A can also cause adult-onset hereditary spastic paraplegia. Neurogenetics 7: 47–50 - PubMed

Publication types

MeSH terms