. 2012 Aug 10;287(33):28152-62.
doi: 10.1074/jbc.M112.340638. Epub 2012 Jun 19.

Mutant p53 aggregates into prion-like amyloid oligomers and fibrils: implications for cancer

Affiliations

Mutant p53 aggregates into prion-like amyloid oligomers and fibrils: implications for cancer

Ana P D Ano Bom et al. J Biol Chem. .

Abstract

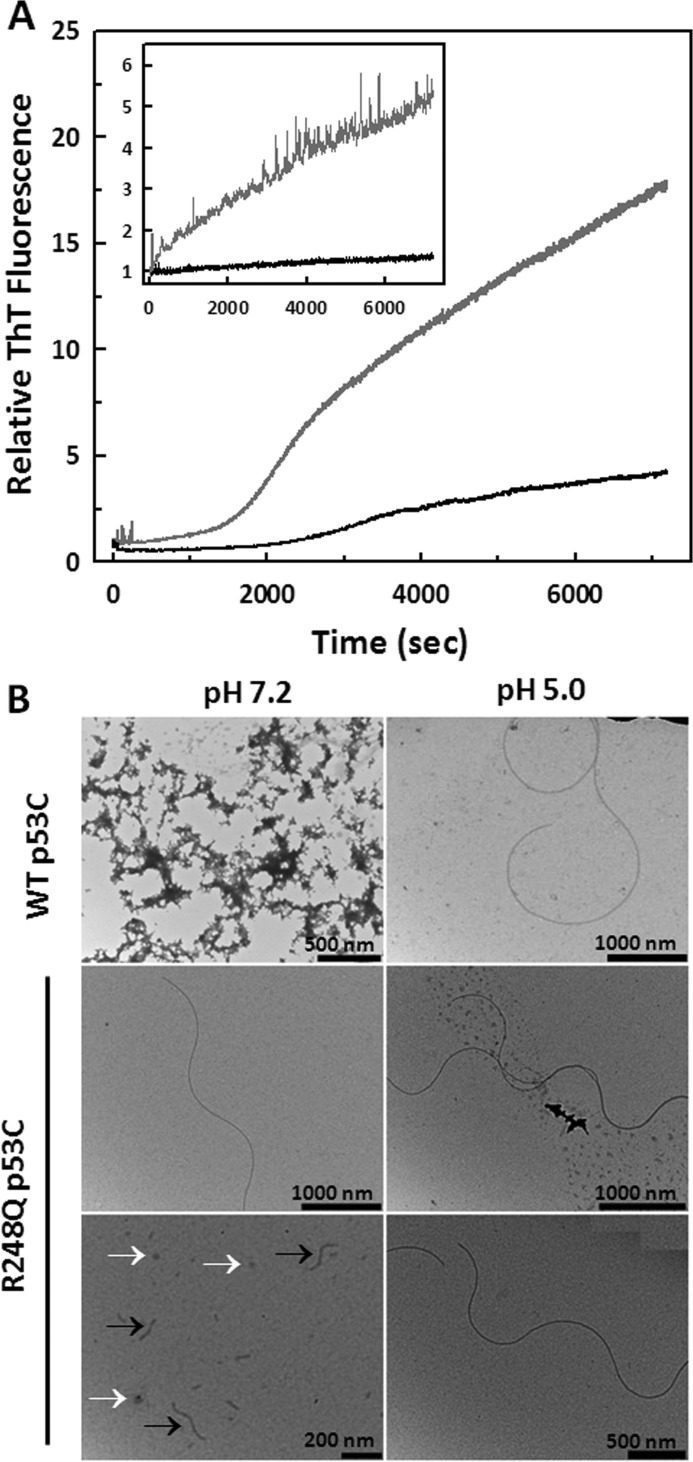
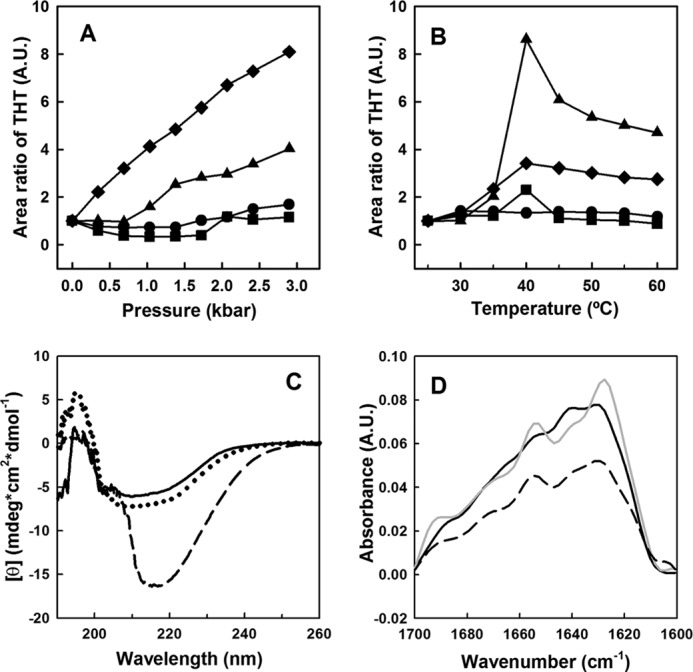
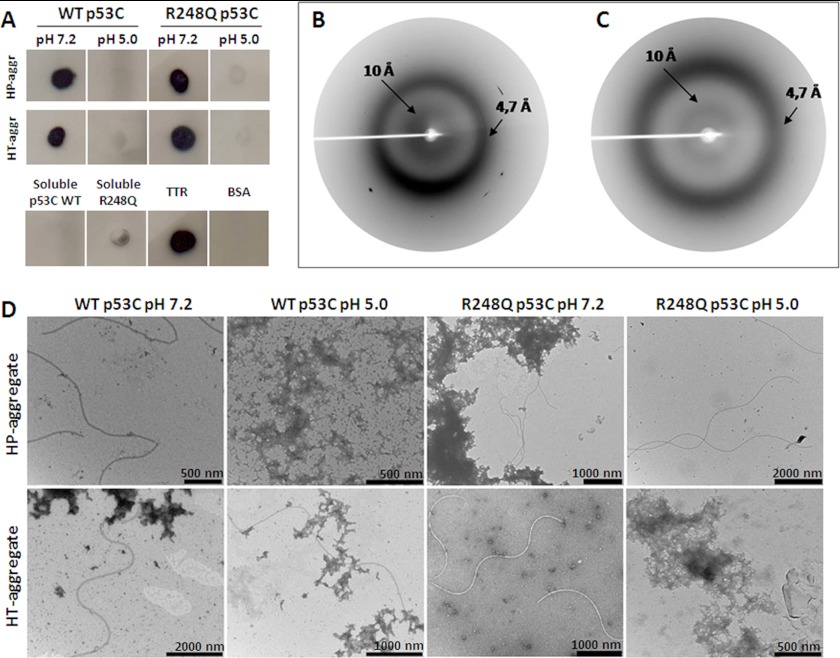
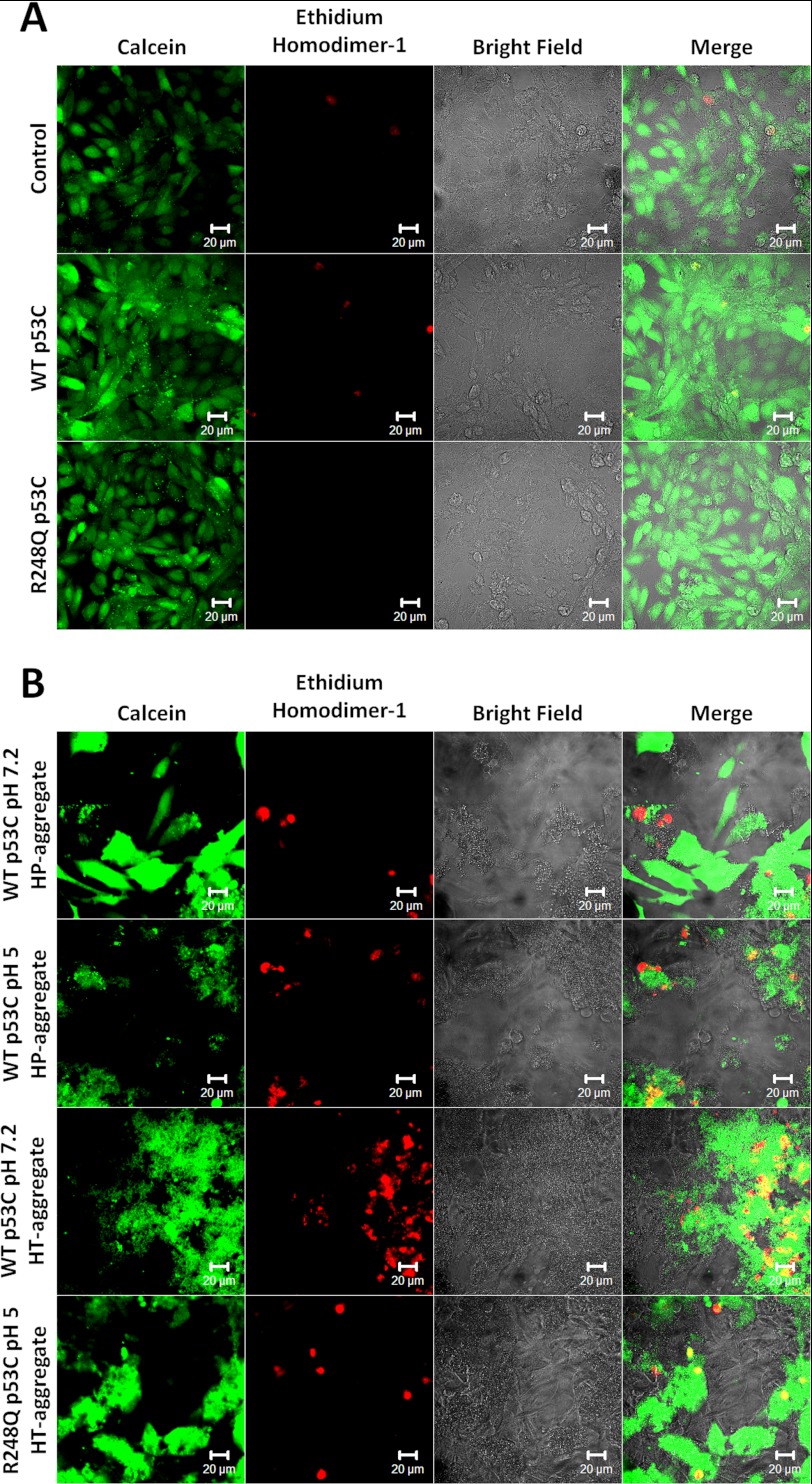
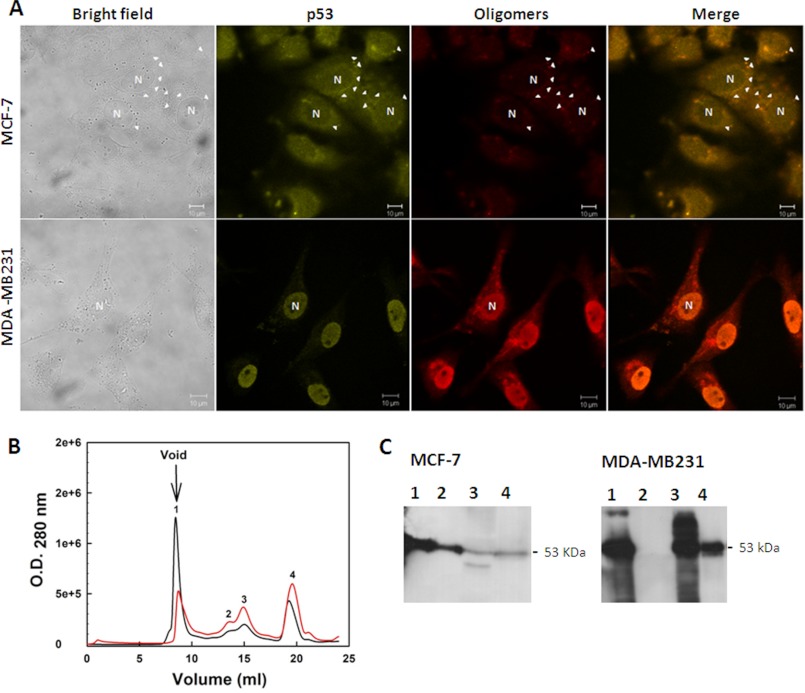
Over 50% of all human cancers lose p53 function. To evaluate the role of aggregation in cancer, we asked whether wild-type (WT) p53 and the hot-spot mutant R248Q could aggregate as amyloids under physiological conditions and whether the mutant could seed aggregation of the wild-type form. The central domains (p53C) of both constructs aggregated into a mixture of oligomers and fibrils. R248Q had a greater tendency to aggregate than WT p53. Full-length p53 aggregated into amyloid-like species that bound thioflavin T. The amyloid nature of the aggregates was demonstrated using x-ray diffraction, electron microscopy, FTIR, dynamic light scattering, cell viabilility assay, and anti-amyloid immunoassay. The x-ray diffraction pattern of the fibrillar aggregates was consistent with the typical conformation of cross β-sheet amyloid fibers with reflexions of 4.7 Å and 10 Å. A seed of R248Q p53C amyloid oligomers and fibrils accelerated the aggregation of WT p53C, a behavior typical of a prion. The R248Q mutant co-localized with amyloid-like species in a breast cancer sample, which further supported its prion-like effect. A tumor cell line containing mutant p53 also revealed massive aggregation of p53 in the nucleus. We conclude that aggregation of p53 into a mixture of oligomers and fibrils sequestrates the native protein into an inactive conformation that is typical of a prionoid. This prion-like behavior of oncogenic p53 mutants provides an explanation for the negative dominance effect and may serve as a potential target for cancer therapy.


Figures

FIGURE 1.
FIGURE 1.
Aggregation kinetics and morphology of WT p53C and mutant R248Q 37T aggregates. A, samples at 5 μm were incubated at 37 °C for 2 h in the presence of ThT at a 5 ThT:1 protein molar ratio at pH 7.2 or pH 5.0. The aggregation was monitored over time based on the increase in ThT fluorescence emission (excitation 450 nm; emission 480 nm) for WT p53C at pH 7.2 (black line) and R248Q at pH 7.2 (gray line). Inset: WT p53C at pH 5.0 (black line) and R248Q at pH 5.0 (gray line). B, images obtained using 5 μm of each sample incubated at 37 °C for 30 min. Black and white arrows indicate fibrillar and oligomeric aggregates, respectively. Scale bars are shown in each figure.
FIGURE 2.
FIGURE 2.
Evaluation of amyloid nature of p53 aggregates by Congo red binding and birefringence. A, soluble and aggregated WT and R248Q p53C samples at 1 μm (pH 7.2) were incubated with Congo Red at 1:10 molar ratio for 30 min. The extent of Congo Red binding to the 37T-aggregates is shown as μmol of bound Congo Red per liter of aggregate solution determined as described under “Experimental Procedures.” B and C, Congo Red green birefringence visualized by polarized light microscopy of WT p53C HT-aggregate (B) and R248Q p53C HT-aggregate (C). The images were obtained at 400× magnification.
FIGURE 3.
FIGURE 3.
Full-length p53 aggregation followed by an increase in ThT fluorescence. A, 2-h kinetics of p53 aggregation followed by ThT binding and an increase in ThT fluorescence. Excitation: 450 nm, emission: 510 nm. B, ThT spectra in the absence (black line) and presence of p53. The blue line corresponds to soluble p53, and the red line corresponds to the ThT spectrum after 12 h of p53 aggregation.
FIGURE 4.
FIGURE 4.
Seeding of wild-type p53 aggregation by aggregated R248Q. Aggregation was monitored by thioflavin T fluorescence emission (excitation: 450 nm; emission: 482 nm) over time at 37 °C. Wild-type p53 at 10 μm (black line) or R248Q at 20 μm was incubated at 37 °C for 30 min, and after 10-fold dilution, the protein was added to 10 μm wild-type p53 (dark gray line). Also, R248Q was seeded alone at 2 μm as a control (gray line). The concentration of ThT was 35 μm, and measurements were performed at pH 7.2 in 10 mm Tris buffer, 150 mm NaCl, 5% glycerol, and 5 mm DTT. The aggregated fraction = (Fobs − FI)/(FF − FI), where F is the ThT fluorescence emission intensity, Fobs represents the observed fluorescence emission, FI is the initial fluorescence, and FF is the final fluorescence.
FIGURE 5.
FIGURE 5.
Characterization of WT p53C and R248Q aggregation induced by high pressure, high temperature, or incubation at 37 °C for 2 h. A, WT p53C at pH 7.2 (diamond) or pH 5.0 (circle) and R248Q at pH 7.2 (triangle) or pH 5.0 (square) at 5 μm were subjected to increasing pressures (up to 3 kbar) or to (B) temperatures ranging from 25 °C to 60 °C, and aggregation was monitored according to ThT fluorescence (50 μm). C, Far-UV CD spectra of R248Q p53C at pH 7.2 (solid line), pH 5.0 (dotted line) and after HT-induced aggregation at pH 5.0 (dashed line). ThT was excited at 450 nm, and light emission was collected from 470 to 530 nm. D, FTIR spectra of non-aggregated R248Q p53C (solid line) and 37T-aggregate of R248Q p53C obtained at pH 7.2 (dashed line) or at pH 5.0 (gray).
FIGURE 6.
FIGURE 6.
p53C amyloid aggregates characterized by dot-blot immunoassay (A), x-ray diffraction (B and C), and TEM (D). A, HP aggregate, HT aggregate, or WT p53C at pH 7.2, WT p53C at pH 5.0, R248Q at pH 7.2, R248Q at pH 5.0, soluble WT p53C, soluble R248Q, aggregated TTR, and soluble BSA. X-ray diffraction spectra of (B) p53C WT and (C) the R248Q HP-aggregate at pH 7.2. D, TEM analysis of the HT and HP aggregates of WT p53C and R248Q at pH 7.2 and pH 5.0. Samples at 5 μm were subjected to increasing temperatures up to 60 °C and pressures up to 3 kbar at 37 °C, and TEM images were collected immediately after the treatments.
FIGURE 7.
FIGURE 7.
Cytotoxicity evaluation of HP and HT aggregates of WT and R248Q p53C. Soluble p53C (A) and aggregated p53C (B) at 4 μm were added to Vero cells, and cell viability was measured using a LIVE/DEAD assay 48 h later. The first panel represents a control consisting of exposure to buffer only.
FIGURE 8.
FIGURE 8.
Detection of native and aggregated p53 in tumor biopsy samples. Paraffin-embedded breast cancer tissues expressing WT p53 or R248Q. The samples were labeled with anti-p53 DO1 and anti-oligomer A11 antibodies. The first column shows p53-labeling, the second column shows the labeling of aggregates, and the third column shows the merged images of p53-labeling and A11-labeling. The images were obtained at 40,000× magnification.
FIGURE 9.
FIGURE 9.
Detection of native and aggregated p53 in breast cancer cell lines. A, MCF-7 (wild-type p53) and MDA-MB 231 (mutated p53) cells were labeled with anti-p53 (DO-1) and anti-oligomer (A11) primary antibodies. The first column shows the bright field images, the second column shows p53-labeling, the third column shows the labeling of aggregates, and the last column shows the merged images of p53 labeling and aggregate labeling. The images were obtained at 63,000× magnification. B, size exclusion chromatography fractions (SEC) of the extract of the MCF-7 (red line) and MDA-MB 231 (black line) tumoral cell lines. Western blotting against p53 was carried out for the eluted fractions (C). Aggregated p53 eluted in the column void volume.
FIGURE 10.
FIGURE 10.
Schematic model for the prionoid conversion and negative dominance of mutant p53. The native conformations of WT and R248Q p53 are represented as green and orange molecules, respectively. The misfolded conformation of either molecule is represented in purple. According to the model, the prion-like character responsible for the negative dominance effect would occur in the oligomers.

Similar articles

Cited by

References

    1. Vousden K. H., Lane D. P. (2007) p53 in health and disease. Nat. Rev. Mol. Cell Biol. 8, 275–283 - PubMed
    1. Joerger A. C., Fersht A. R. (2008) Structural biology of the tumor suppressor p53. Annu. Rev. Biochem. 77, 557–582 - PubMed
    1. Ishimaru D., Andrade L. R., Teixeira L. S., Quesado P. A., Maiolino L. M., Lopez P. M., Cordeiro Y., Costa L. T., Heckl W. M., Weissmüller G., Foguel D., Silva J. L. (2003) Fibrillar aggregates of the tumor suppressor p53 core domain. Biochemistry 42, 9022–9027 - PubMed
    1. Silva J. L., Vieira T. C., Gomes M. P., Ano Bom A. P., Lima L. M., Freitas M. S., Ishimaru D., Cordeiro Y., Foguel D. (2010) Ligand binding and hydration in protein misfolding: insights from studies of prion and p53 tumor suppressor proteins. Acc. Chem. Res. 43, 271–279 - PMC - PubMed
    1. Galea C., Bowman P., Kriwacki R. W. (2005) Disruption of an intermonomer salt bridge in the p53 tetramerization domain results in an increased propensity to form amyloid fibrils. Prot. Sci. 14, 2993–3003 - PMC - PubMed

Publication types

MeSH terms