Clinical Trial
. 2012;7(6):e38510.
doi: 10.1371/journal.pone.0038510. Epub 2012 Jun 8.

Effector CD4+ T cell expression signatures and immune-mediated disease associated genes

Affiliations
Clinical Trial

Effector CD4+ T cell expression signatures and immune-mediated disease associated genes

Wei Zhang et al. PLoS One. 2012.

Abstract

Genome-wide association studies (GWAS) in immune-mediated diseases have identified over 150 associated genomic loci. Many of these loci play a role in T cell responses, and regulation of T cell differentiation plays a critical role in immune-mediated diseases; however, the relationship between implicated disease loci and T cell differentiation is incompletely understood. To further address this relationship, we examined differential gene expression in naïve human CD4+ T cells, as well as in in vitro differentiated Th1, memory Th17-negative and Th17-enriched CD4+ T cells subsets using microarray and RNASeq. We observed a marked enrichment for increased expression in memory CD4+ compared to naïve CD4+ T cells of genes contained among immune-mediated disease loci. Within memory T cells, expression of disease-associated genes was typically increased in Th17-enriched compared to Th17-negative cells. Utilizing RNASeq and promoter methylation studies, we identified a differential regulation pattern for genes solely expressed in Th17 cells (IL17A and CCL20) compared to genes expressed in both Th17 and Th1 cells (IL23R and IL12RB2), where high levels of promoter methylation are correlated to near zero RNASeq levels for IL17A and CCL20. These findings have implications for human Th17 celI plasticity and for the regulation of Th17-Th1 expression signatures. Importantly, utilizing RNASeq we found an abundant isoform of IL23R terminating before the transmembrane domain that was enriched in Th17 cells. In addition to molecular resolution, we find that RNASeq provides significantly improved power to define differential gene expression and identify alternative gene variants relative to microarray analysis. The comprehensive integration of differential gene expression between cell subsets with disease-association signals, and functional pathways provides insight into disease pathogenesis.


Conflict of interest statement

Competing Interests: The authors have declared that no competing interests exist.

Figures

Figure 1
Figure 1. CD4+ T cell subsets.
A. CD4+CD25- T cells were sorted by flow cytometry into CD45RO- and CD45RO+ subsets. Memory CD4+CD25-CD45RO+ cells were sorted into CD161+ CCR6+ and CD161-CCR6- subsets for subsequent activation and expansion. B. Th1 cells were generated from naïve CD4+CD62L+CD25-CD45RO- T cells by activating and expanding with anti-CD3, anti-CD28 in the presence of IL-12 and anti-IL4 for seven days. CD161+CCR6+ and CD161-CCR6- memory CD4+ T cells were activated and expanded with anti-CD3, anti-CD28, IL-1β and IL-23 for seven days. The distinct T cell subsets were assessed for differentiation by intracellular cytokine staining for IL-17A and IFNγ expression. Representative flow cytometry plots are shown in the figure.
Figure 2
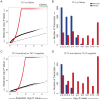
Figure 2. Improved power to identify differential gene expression with RNAseq.
A. Q-Q plot for observed and expected P-Values for differential gene expression comparing in vitro differentiated Th1 and Naïve CD4+ T cells (N = 4). B. Observed statistical significance for differential gene expression between in vitro differentiated Th1 and Naïve CD4+ T cells (N = 4). C. Q-Q plot for observed and expected P-values for differential gene expression comparing Th17-enriched and Th17-negative CD4+ memory T cells. D. Observed statistical significance for differential gene expression between Th17-enriched and Th17-negative CD4+ T cells.
Figure 3
Figure 3. Preponderance of disease-associated transcripts upregulated in Th17 and in vitro differentiated Th1 cells.
Hierarchical clustering was performed on 195 transcripts with increased expression in Th17-enriched (red, increased expression relative to other cell types) compared to Th17-negative (blue, decreased expression) and differential expression P-values less than 1×10−09. Asterisks (*) designate the transcripts within immune-mediated disease loci. There are total 32 immune-mediated disease associated genes with names marked in the figure.
Figure 4
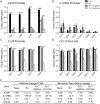
Figure 4. Differential gene expression between CD4+ T cell subsets results from distinct molecular mechanisms.
Shown are the fractions of methylation at conserved CpG promoter sites estimated by mass spectrometry (N = 5) for A. IL23R, B. IL12RB2, C. IL17A and D. CCL20 promoters. Paired t-tests were used to test for differential methylation fractions between naïve vs. Th1 and Th17-negative vs. Th17-enriched were estimated by paired t-test; *P<0.05, **P<0.01, ***P<0.001. E. Average expression estimates from four individulas in both RNASeq and microarray show that Th17-specific transcripts IL17A and CCL20 have nearly zero expression in Th17-negative cells, corresponding to high promoter methylation levels (C–D). Gene expression was measured by FPKM (fragments of RNA per Kilobase of exon per Million fragments mapped) for RNASeq and log2 RMA normalized intensity for microarray.
Figure 5
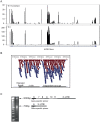
Figure 5. Abundantly expressed, novel IL23R isoform.
A. Sequence reads were mapped to the IL23R gene region in Th17-enriched and in vitro differentiated Th1 cells using Tophat v1.3.3. The intron 6 region was highly covered in both the Th17-enriched and Th1 cell subsets. The scale on the y-axis represents coverage (average number of reads that cover a particular base). B. Zoom in picture of extended coverage on exon 6 and intron 6. Blue and red bars correspond to sense- and anti-sense reads, respectively. The expanded inset demonstrates sequence reads mapping to an extended exon 6 resulting in a stop signal 9 codons downstream with contiguous 3′UTR sequence; in addition an independent transcript maps immediately centromeric to this. C. 3′ RACE (rapid amplification of cDNA ends) was performed, and 2000 and 700 base pair fragments were sequenced, confirming the exon contents designated. The 700 base pair transcript terminating in the intron 6 region would encode for a transcript terminating prior to the transmembrane domain in exon 9.

References

    1. Zenewicz LA, Abraham C, Flavell RA, Cho JH. Unraveling the genetics of autoimmunity. Cell. 2010;140:797. - PMC - PubMed
    1. Duerr RH, Taylor KD, Brant SR, Rioux JD, Silverberg MS. A genome-wide association study identifies IL23R as an inflammatory bowel disease gene. Science. 2006;314:1463. - PMC - PubMed
    1. Cargill M, Schrodi SJ, Chang M, Garcia VE, Brandon R. A large-scale genetic association study confirms IL12B and leads to the identification of IL23R as psoriasis-risk genes. Am J Hum Genet. 2007;80:290. - PMC - PubMed
    1. Burton PR, Clayton DG, Cardon LR, Craddock N, Deloukas P. Association scan of 14,500 nonsynonymous SNPs in four diseases identifies autoimmunity variants. Nat Genet. 2007;39:1337. - PMC - PubMed
    1. Ghoreschi K, Laurence A, Yang XP, Tato CM, McGeachy MJ. Generation of pathogenic T(H)17 cells in the absence of TGF-beta signalling. Nature. 2010;467:971. - PMC - PubMed

Publication types