. 2012 Sep;59(9):2476-85.
doi: 10.1109/TBME.2012.2204882. Epub 2012 Jun 14.

Signal quality estimation with multichannel adaptive filtering in intensive care settings

Affiliations

Signal quality estimation with multichannel adaptive filtering in intensive care settings

Ikaro Silva et al. IEEE Trans Biomed Eng. 2012 Sep.

Abstract

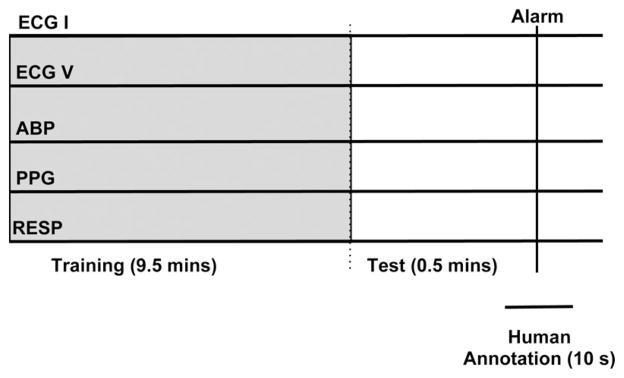
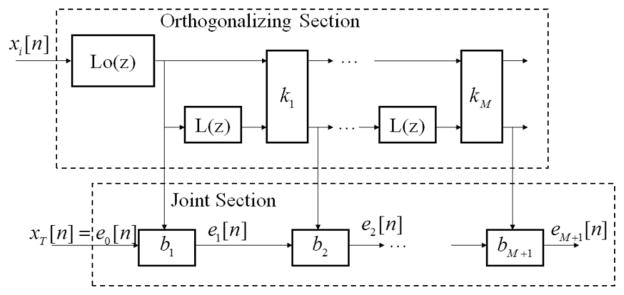
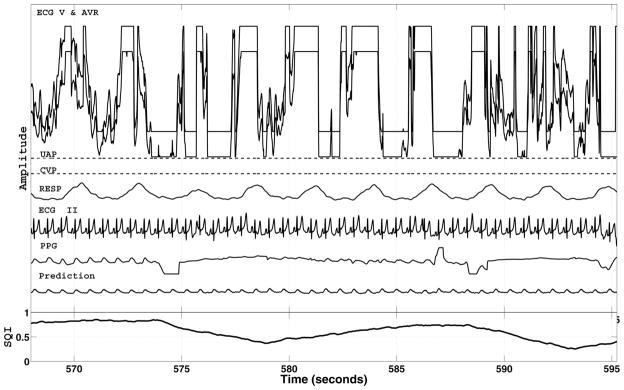
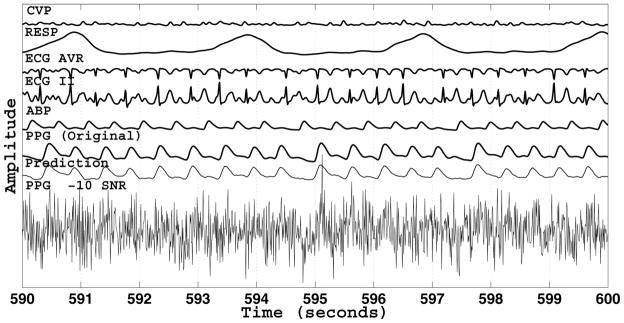
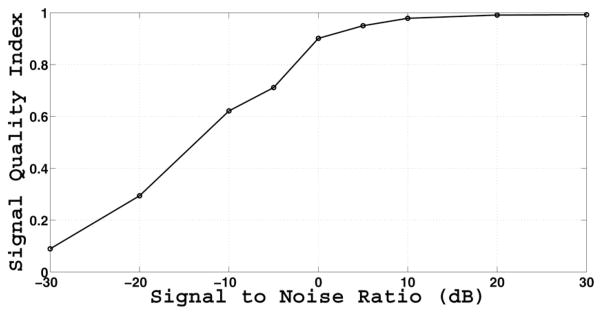
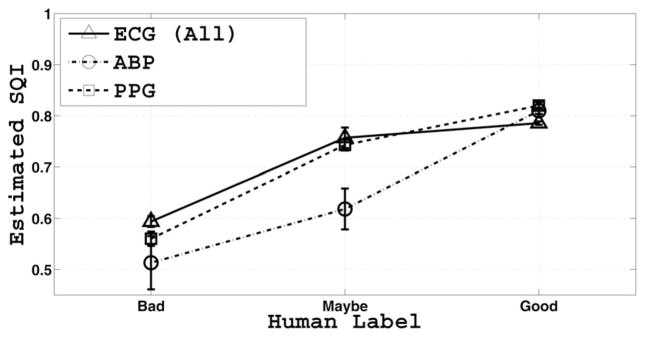
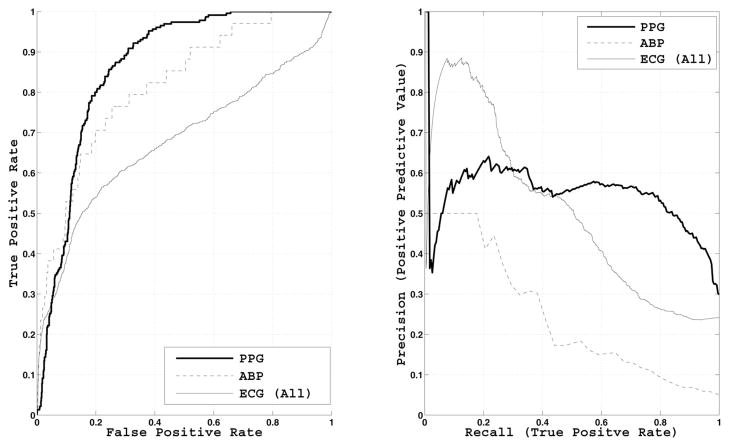
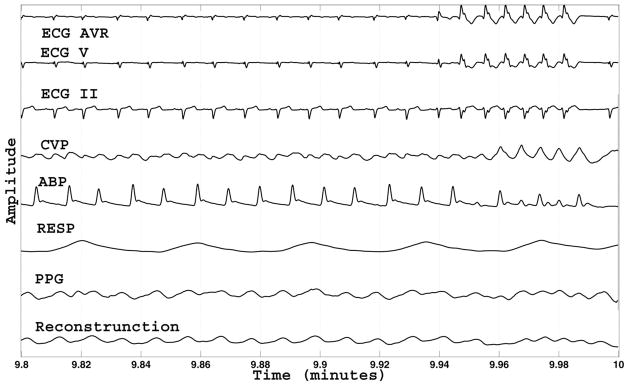
A signal quality estimate of a physiological waveform can be an important initial step for automated processing of real-world data. This paper presents a new generic point-by-point signal quality index (SQI) based on adaptive multichannel prediction that does not rely on ad hoc morphological feature extraction from the target waveform. An application of this new SQI to photoplethysmograms (PPG), arterial blood pressure (ABP) measurements, and ECG showed that the SQI is monotonically related to signal-to-noise ratio (simulated by adding white Gaussian noise) and to subjective human quality assessment of 1361 multichannel waveform epochs. A receiver-operating-characteristic (ROC) curve analysis, with the human "bad" quality label as positive and the "good" quality label as negative, yielded areas under the ROC curve of 0.86 (PPG), 0.82 (ABP), and 0.68 (ECG).


Figures

Fig. 1
Fig. 1
Schematic illustration of the annotation process. No actual signals are shown. The epochs were chosen based on the triggering of an arrhythmia alarm. The human annotators rated the quality of the epoch around the alarm time. A 10-min segment prior and up to the alarm was used by the algorithm.
Fig. 2
Fig. 2
Overview of MCAF prediction. Note that the estimates θi are scalars on a sample-by-sample basis. The MCAF consists of a bank of GALL filters, in which individual channels attempt to predict the target channel. These individual predictions θi are then linearly combined through a Kalman filter for the final estimate.
Fig. 3
Fig. 3
Overview of the GALL filter. The GALL filter is similar to a standard gradient adaptive lattice filter, but with delays replaced by Laguerre functions.
Fig. 4
Fig. 4
Example of the MCAF prediction and estimated point-by-point SQI using the PPG signal as target. Because of filtering, there is a 5-s delay in the SQI. The SQI is based on the error between the recorded PPG signal and its MCAF reconstruction, labeled as “Prediction.” All recorded channels (including those which are badly corrupted) were used as inputs to the MCAF filter. The MCAF filter adaptively selects the best channels for prediction.
Fig. 5
Fig. 5
Result of the Gaussian noise simulation at a SNR of − 10 dB. The noise was added to the entire PPG signal. That is, “PPG − 10 SNR” was always the target signal. The original uncorrupted PPG signal is displayed for comparison purposes and was not used by the MCAF algorithm for prediction.
Fig. 6
Fig. 6
Estimated SQI as a function of SNR simulated with additive white Gaussian noise. The PPG signal is the target. The SQI is a monotonic function of SNR, and asymptotically approaches 0 and 1.
Fig. 7
Fig. 7
Mean and standard error of SQI values as a function of expert labels. The SQI is a monotonic function of expert label.
Fig. 8
Fig. 8
ROC and PR curves of estimated SQI for ABP, ECG (All), and PPG waveforms with human signal quality assessment as gold standard. The areas under the curves are tabulated in Table III.
Fig. 9
Fig. 9
Example of the MCAF tracking when the signals are clean and a genuine change in physiological condition occurs. Although the estimated SQI is still high (> 0.7), suggestions for improving and validating the MCAF tracking are mentioned in the text.
Fig. 10
Fig. 10
Another example of the MCAF tracking when the signals are clean and a genuine change in physiological condition occurs. In this case, the tracking on the PPG signal yields reasonable results.

References

    1. Wang JY. A new method for evaluating ECG signal quality for multi-lead arrhythmia analysis. Comput Cardiol. 2002;29:85–88.
    1. Silva I, Moody G, Celi L. The physionet/computing in cardiology challenge 2011 : Improving the quality of ECGs collected using mobile phones. Comput Cardiol. 2011;38:273–276.
    1. Lovell NH, Redmond SJ, Basilakis J, Celler BG. Biosignal Quality Detection: An Essential Feature for Unsupervised Telehealth Applications. Proc 12th IEEE Int Conf e-Health Netw Appl Services. 2010:81–85.
    1. Sukor JA, Redmond SJ, Lovell NH. Signal quality measures for pulse oximetry through waveform morphology analysis. Physiol Meas. 2011;32(3):369–384. - PubMed
    1. Baura G. System Theory and Practical Applications of Biomedical Signals. Piscataway, NJ: IEEE Press; 2002.

Publication types