Clinical Trial
. 2013 Apr;20(4):361-9.
doi: 10.1038/gt.2012.43. Epub 2012 Jun 21.

Efficacy and long-term safety of alipogene tiparvovec (AAV1-LPLS447X) gene therapy for lipoprotein lipase deficiency: an open-label trial

Affiliations
Clinical Trial

Efficacy and long-term safety of alipogene tiparvovec (AAV1-LPLS447X) gene therapy for lipoprotein lipase deficiency: an open-label trial

D Gaudet et al. Gene Ther. 2013 Apr.

Abstract

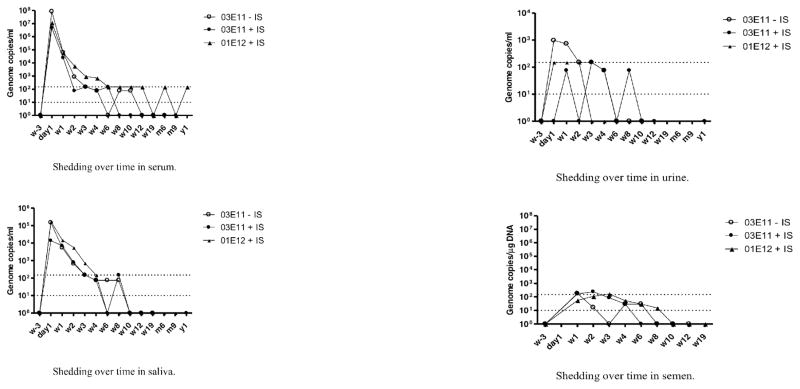
We describe the 2-year follow-up of an open-label trial (CT-AMT-011-01) of AAV1-LPL(S447X) gene therapy for lipoprotein lipase (LPL) deficiency (LPLD), an orphan disease associated with chylomicronemia, severe hypertriglyceridemia, metabolic complications and potentially life-threatening pancreatitis. The LPL(S447X) gene variant, in an adeno-associated viral vector of serotype 1 (alipogene tiparvovec), was administered to 14 adult LPLD patients with a prior history of pancreatitis. Primary objectives were to assess the long-term safety of alipogene tiparvovec and achieve a ≥40% reduction in fasting median plasma triglyceride (TG) at 3-12 weeks compared with baseline. Cohorts 1 (n=2) and 2 (n=4) received 3 × 10(11) gc kg(-1), and cohort 3 (n=8) received 1 × 10(12) gc kg(-1). Cohorts 2 and 3 also received immunosuppressants from the time of alipogene tiparvovec administration and continued for 12 weeks. Alipogene tiparvovec was well tolerated, without emerging safety concerns for 2 years. Half of the patients demonstrated a ≥40% reduction in fasting TG between 3 and 12 weeks. TG subsequently returned to baseline, although sustained LPL(S447X) expression and long-term changes in TG-rich lipoprotein characteristics were noted independently of the effect on fasting plasma TG.

Trial registration: ClinicalTrials.gov NCT01109498.


Conflict of interest statement

Conflict of Interest

The funding body (AMT) was involved in all aspects of the study (study design, data collection and analysis, and data interpretation in collaboration with the CRO and principal investigator. Five authors (J.dW., J.T., S.vD., N.vdB. and V.S-F) are employees of AMT. The remaining authors declare no conflict of interest. The principal investigator of the study (DG) has no financial interest in AMT and made all final editorial decisions regarding the manuscript.

Figures

Figure 1
Figure 1
Presence of AMT-011 Vector DNA in body fluids: Results are depicted as median values per treatment group, per time point. Dashed lines indicate limit of detection (bottom line) and limit of quantification (top line) of the assay (A: shedding in serum; B; shedding in saliva; C: shedding in urine; D: shedding in semen).
Figure 2
Figure 2
Paraffin-embedded cross-section of the muscle biopsy (injected muscle) from subject 09, stained with H&E; showing a large focal infiltrate and diffuse infiltration throughout the biopsy
Figure 3
Figure 3
Figure 3A: General histology as noted in cryosections of the injected muscle from subject 11 who was one of two patients (09 and 11) to show a more pronounced local response. (A–D) injected muscle (I): (A & B) H&E staining showing (large) perivascular and endomysial infiltration of the injected tissue. Some freezing artifacts are observed. Arrows in (B) indicate small, irregularly shaped degenerating fibers with subsarcolemmal accumulations with neighboring endomysial infiltrates; (C) uneven NADH stain, arrows pointing to increased staining of the subsarcolemmal accumulations noted in (B); (D) accumulation of neutral lipid, visualized by Oil Red O staining. (E&F) non-injected muscle; (E) H&E staining showing largely normal histology except for a single ragged red fiber (indicated by arrow); (F) normal neutral lipid content as visualized using Oil Red O. Figure 3B: Immunohistochemical staining of cryosections of injected muscle from subject 09 who was one of two patients (09 and 11) to show a more pronounced local response. (A) CD3+ T-lymphocytes found within the injected tissue as a large perivascular infiltrate, and more diffuse endomysial infiltration; (B) staining for CD8+ T-lymphocytes in the same area; (C) CD20+ B-lymphocytes in the same area; (D) CD68+ macrophages within the same area; (E and F) staining for MHC class I and –II surface receptors more distal to large infiltrates, showing positivity on the surface of muscle fibers (in addition to positivity of infiltrates).
Figure 3
Figure 3
Figure 3A: General histology as noted in cryosections of the injected muscle from subject 11 who was one of two patients (09 and 11) to show a more pronounced local response. (A–D) injected muscle (I): (A & B) H&E staining showing (large) perivascular and endomysial infiltration of the injected tissue. Some freezing artifacts are observed. Arrows in (B) indicate small, irregularly shaped degenerating fibers with subsarcolemmal accumulations with neighboring endomysial infiltrates; (C) uneven NADH stain, arrows pointing to increased staining of the subsarcolemmal accumulations noted in (B); (D) accumulation of neutral lipid, visualized by Oil Red O staining. (E&F) non-injected muscle; (E) H&E staining showing largely normal histology except for a single ragged red fiber (indicated by arrow); (F) normal neutral lipid content as visualized using Oil Red O. Figure 3B: Immunohistochemical staining of cryosections of injected muscle from subject 09 who was one of two patients (09 and 11) to show a more pronounced local response. (A) CD3+ T-lymphocytes found within the injected tissue as a large perivascular infiltrate, and more diffuse endomysial infiltration; (B) staining for CD8+ T-lymphocytes in the same area; (C) CD20+ B-lymphocytes in the same area; (D) CD68+ macrophages within the same area; (E and F) staining for MHC class I and –II surface receptors more distal to large infiltrates, showing positivity on the surface of muscle fibers (in addition to positivity of infiltrates).
Figure 4
Figure 4
Figure 4A: Distribution of plasma TG and cholesterol in the Sf >400 and Sf 20–400 fractions before therapy and 52 weeks after alipogene tiparvovec administration. Figure 4B: Total APOB in the Sf 20–400 fraction before therapy and 12 and 52 weeks after alipogene tiparvovec administration.
Figure 4
Figure 4
Figure 4A: Distribution of plasma TG and cholesterol in the Sf >400 and Sf 20–400 fractions before therapy and 52 weeks after alipogene tiparvovec administration. Figure 4B: Total APOB in the Sf 20–400 fraction before therapy and 12 and 52 weeks after alipogene tiparvovec administration.

References

    1. Brunzell JD, Deeb SS. Familial lipoprotein lipase deficiency, Apo C-II deficiency and hepatic lipase deficiency. In: Scriver CR, Beaudet AL, Sly WS, Valle D, editors. The Metabolic Basis of Inherited Disease. 8. New York, NY: McGraw-Hill; 2001. pp. 2789–2816.
    1. Black DM, Sprecher DL. Dietary treatment and growth of hyperchylomicronemic children severely restricted in dietary fat. Am J Dis Child. 1993;147:60–62. - PubMed
    1. Chait A, Robertson HT, Brunzell JD. Chylomicronemia syndrome in diabetes mellitus. Diabetes Care. 1981;4:343–348. - PubMed
    1. Chait A, Brunzell JD. Chylomicronemia syndrome. Adv Int Med. 1992;37:249–273. - PubMed
    1. Santamarina-Fojo S. The familial chylomicronemia syndrome. Endocrinol Metab Clin North Am. 1998;27:551–567. - PubMed

Publication types

Associated data

Grants and funding