. 2012 Aug 10;287(33):27930-40.
doi: 10.1074/jbc.M111.337295. Epub 2012 Jun 20.

The rates of Ca2+ dissociation and cross-bridge detachment from ventricular myofibrils as reported by a fluorescent cardiac troponin C

Affiliations

The rates of Ca2+ dissociation and cross-bridge detachment from ventricular myofibrils as reported by a fluorescent cardiac troponin C

Sean C Little et al. J Biol Chem. .

Abstract

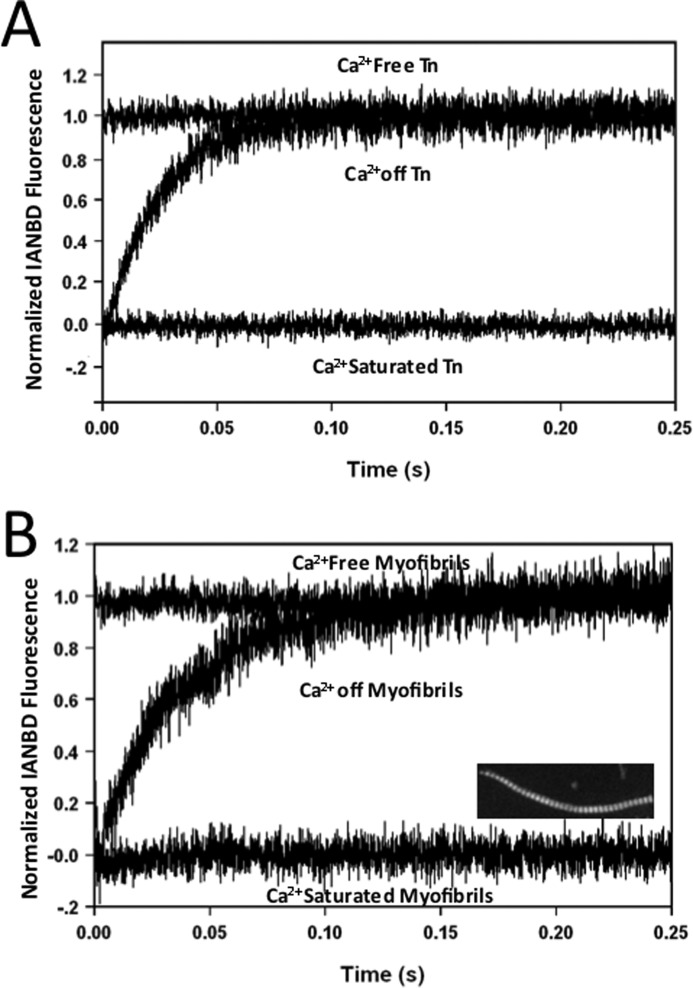
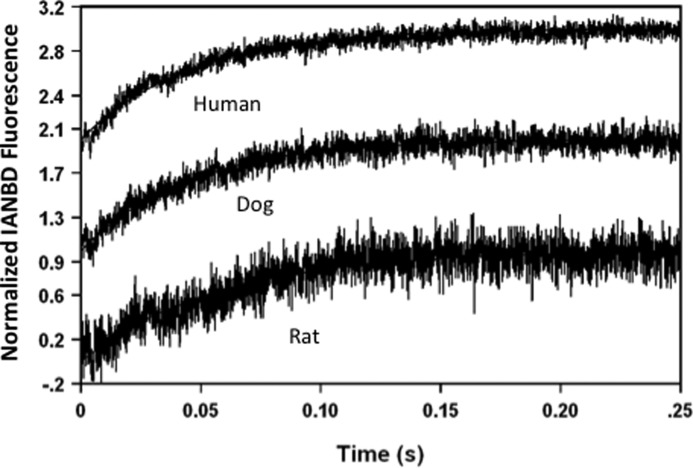
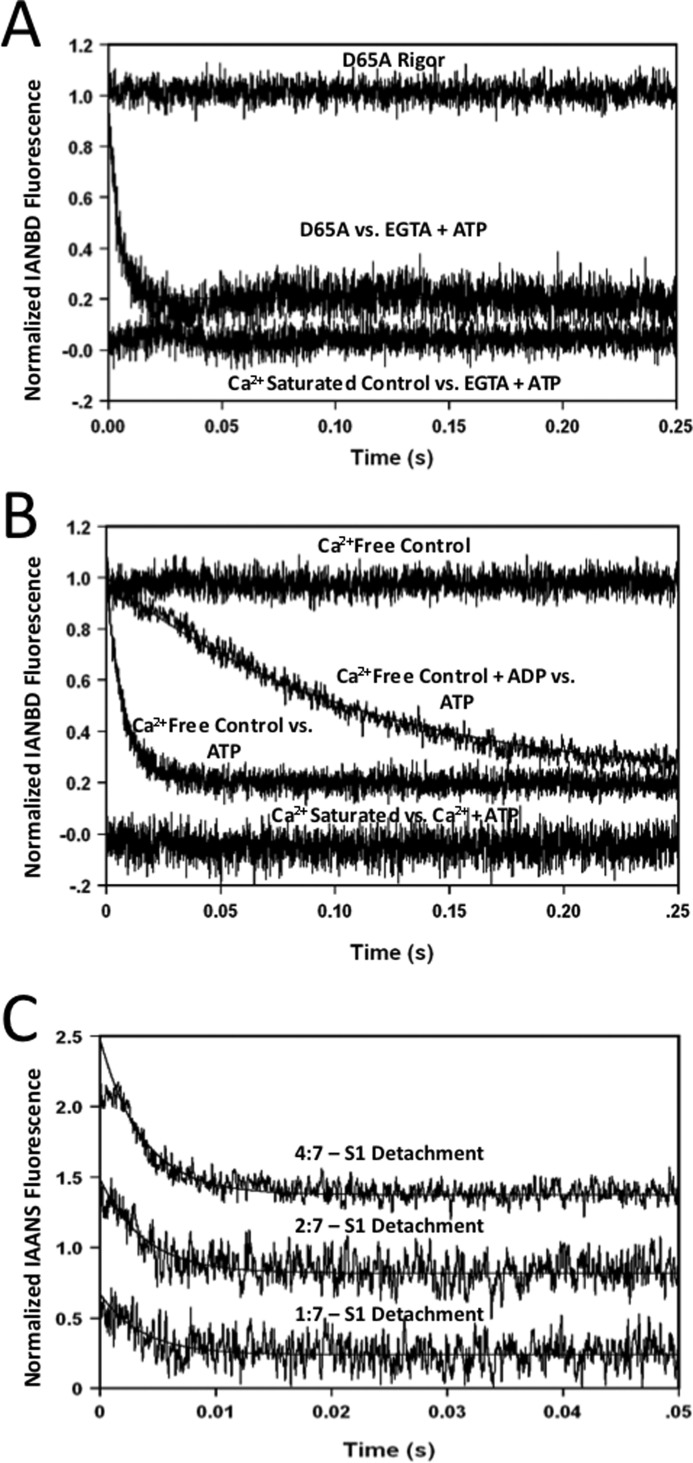
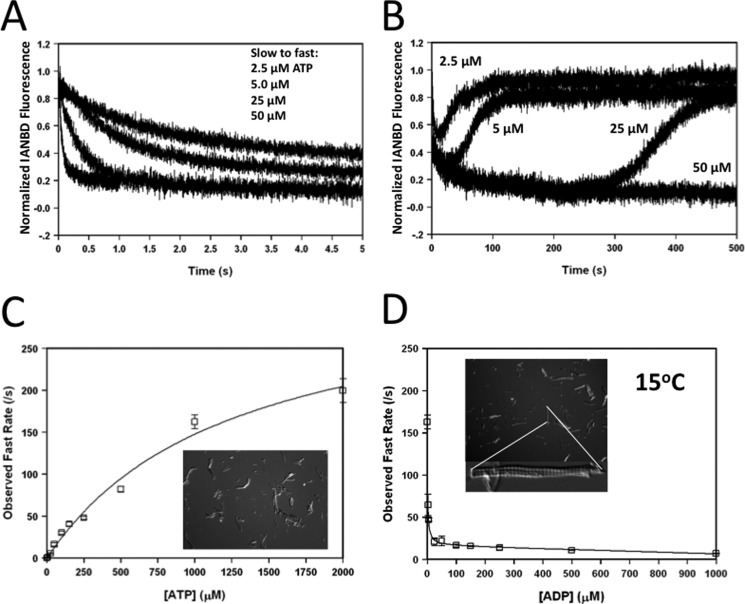
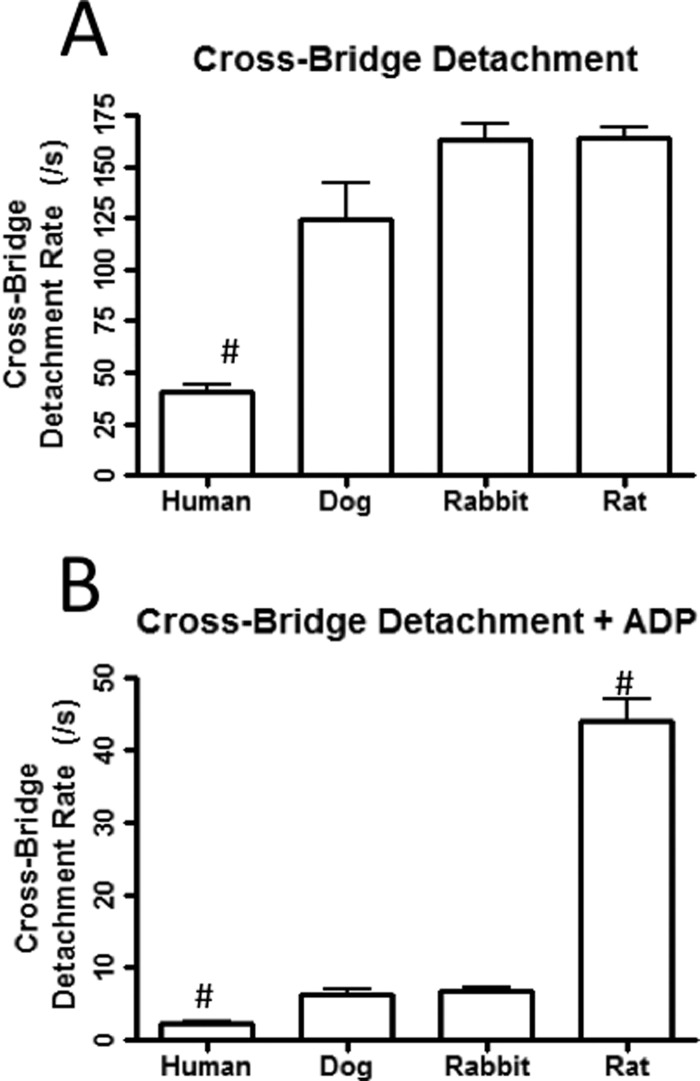
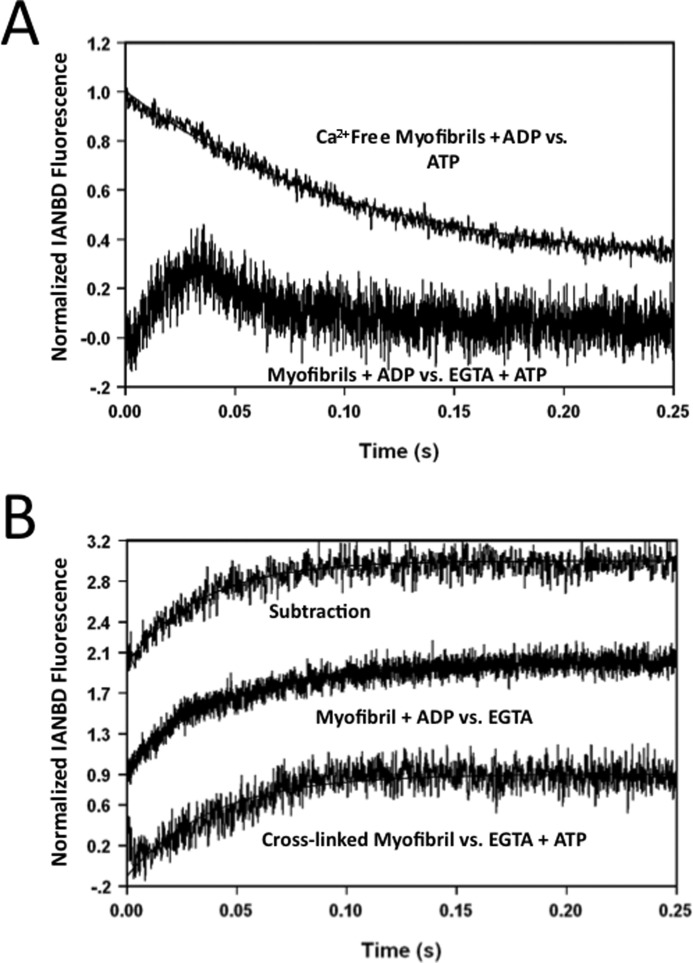
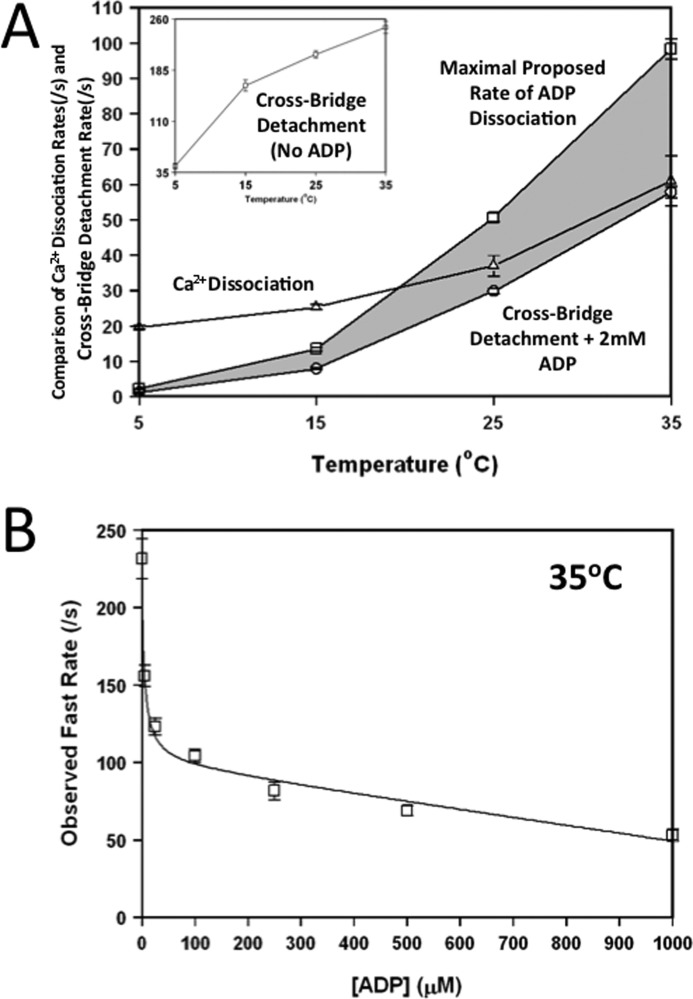
The rate-limiting step of cardiac muscle relaxation has been proposed to reside in the myofilament. Both the rates of cross-bridge detachment and Ca(2+) dissociation from troponin C (TnC) have been hypothesized to rate-limit myofilament inactivation. In this study we used a fluorescent TnC to measure both the rate of Ca(2+) dissociation from TnC and the rate of cross-bridge detachment from several different species of ventricular myofibrils. The fluorescently labeled TnC was sensitive to both Ca(2+) dissociation and cross-bridge detachment at low Ca(2+) (presence of EGTA), allowing for a direct comparison between the two proposed rates of myofilament inactivation. Unlike Ca(2+) dissociation from TnC, cross-bridge detachment varied in myofibrils from different species and was rate-limited by ADP release. At subphysiological temperatures (<20 °C), the rate of Ca(2+) dissociation from TnC was faster than the rate of cross-bridge detachment in the presence of ADP. These results support the hypothesis that cross-bridge detachment rate-limits relaxation. However, Ca(2+) dissociation from TnC was not as temperature-sensitive as cross-bridge detachment. At a near physiological temperature (35 °C) and ADP, the rate of cross-bridge detachment may actually be faster than the rate of Ca(2+) dissociation. This provides evidence that there may not be a simple, single rate-limiting step of myofilament inactivation.


Figures

FIGURE 1.
FIGURE 1.
Ca2+ dissociation from IANBD-labeled TnC in Tn and Tn-exchanged rabbit rigor myofibrils. Panel A shows the time course of IANBD fluorescence as Ca2+ was chelated by EGTA and removed from the regulatory binding site of TnCIANBDT53C reconstituted into Tn. The Tn (0.3 μm) in Buffer A + 200 μm Ca2+ was rapidly mixed with an equal volume of Buffer A + 10 mm EGTA at 15 °C (Ca2+ off Tn trace, 40.8 ± 0.5/s). The Ca2+-saturated Tn base line was collected by mixing the Ca2+-saturated Tn with Buffer A + 200 μm Ca2+. The Ca2+-free Tn base line was acquired by rapidly mixing Tn in Buffer A + 5 mm EGTA against equal volumes of Buffer A + 5 mm EGTA. Panel B shows the time course of the IANBD fluorescence as Ca2+ was removed by EGTA from TnCIANBDT53C Tn-exchanged rabbit rigor ventricular myofibrils. TnCIANBDT53C myofibrils in Buffer A + 200 μm Ca2+ were rapidly mixed with an equal volume of the Buffer A + 10 mm EGTA at 15 °C (Ca2+ off Myofibrils trace, 25.3 ± 0.7/s). The Ca2+-saturated and Ca2+-free myofibril base lines were acquired from TnCIANBDT53C myofibrils under same buffer conditions as described for TnCIANBDT53CTn in panel A.
FIGURE 2.
FIGURE 2.
Effect of myofibril species on the rate of Ca2+ dissociation from Tn-exchanged rigor myofibrils. TnCIANBDT53C Tn was exchanged into rat, dog, and failing human ventricular myofibrils to acquire the apparent rates of Ca2+ dissociation for the respective myofibrils. The rigor Ca2+ dissociation rates for the different species were; rat (16.7 ± 0.5/s), dog (21.6 ± 0.7/s), and failing human ventricular myofibrils (22.9 ± 0.9/s). Buffer conditions were identical to those described for panel B of Fig. 1. All traces were acquired at 15 °C. The data traces were normalized and staggered for clarity.
FIGURE 3.
FIGURE 3.
Effect of ATP on rabbit ventricular myofibrils and reconstituted thin filaments + S1. Panel A shows the time course of IANBD fluorescence as Ca2+ was removed from TnCIANBDT53C and D65A TnCIANBDT53C rabbit myofibrils in the presence of ATP. TnCIANBDT53C rabbit myofibrils (Ca2+ Saturated Control versus EGTA + ATP trace, no observed rate) and D65A TnCIANBDT53C rabbit myofibrils (D65A versus EGTA + ATP trace, 203 ± 11/s) in Buffer A + 200 μm Ca2+ were mixed with an equal volume of the Buffer A + 10 mm EGTA and 2 mm ATP at 15 °C. The D65A TnCIANBDT53C Ca2+-free myofibril base line was acquired by rapidly mixing the D65A myofibrils in Buffer A + 5 mm EGTA against equal volumes of Buffer A + 5 mm EGTA (D65A Rigor). Panel B shows the time course of IANBD fluorescence decay from Ca2+-free TnCIANBDT53C rabbit myofibrils by mixing with ATP in the presence or absence of ADP. TnCIANBDT53C myofibrils in Buffer A + 5 mm EGTA ± 2 mm ADP were rapidly mixed with equal volumes of the Buffer A + 5 mm EGTA + 2 mm ATP (Ca2+-free Myofibrils versus ATP trace, 163 ± 8/s, and Ca2+-free Myofibrils + ADP versus ATP trace, 6.9 ± 0.6/s, respectively). To examine the effect of ATP on the Ca2+-saturated state, TnCIANBDT53C myofibrils in Buffer A + 200 μm Ca2+ were mixed with an equal volume of Buffer A + 200 μm Ca2+ + 2 mm ATP (Ca2+ Saturated versus Ca2+ + ATP trace, no observed rate). The Ca2+-free base line (Ca2+-free Control trace) from Fig. 1B was included as a reference point for the fluorescence decay induced by ATP. Panel C shows the time course of IAANS fluorescence decay from Ca2+-free reconstituted thin filaments containing TnCIAANST53C Tn upon dissociation of myosin-S1. TnCIAANST53C reconstituted thin filaments with a myosin S1 to actin subunit ratio of 1:7, 2:7 and 4:7 in Buffer A (without Tween 20) + 5 mm EGTA were rapidly mixed with equal volumes of the Buffer A (without Tween 20) + 5 mm EGTA + 2 mm ATP. The rates of S1 detachment reconstituted at the ratios of 1:7, 2:7, and 4:7 concentrations were ∼300/s, 268 ± 11/s, and 265 ± 10/s, respectively. All data were collected at 15 °C.
FIGURE 4.
FIGURE 4.
Dose dependence of ATP and ADP on the rate of cross-bridge detachment. Panel A shows the effect of increasing ATP on the apparent rate (fast phase) of cross-bridge detachment from Ca2+-free TnCIANBDT53C rabbit myofibrils. TnCIANBDT53C rabbit myofibrils in Buffer A + 5 mm EGTA were mixed against equal volumes of Buffer A + 5 (0.51 ± 0.02/s), 10 (1.1 ± 0.2/s), 50 (5.5 ± 0.6/s), or 100 (16 ± 2/s) μm ATP (traces shown top to bottom, respectively). Panel B shows the triphasic fluorescence change that occurs upon ATP addition to the Ca2+-free TnCIANBDT53C rabbit myofibrils with increasing ATP from 5 to 100 μm over an extended period of time. The Ca2+-free base line over these long times displayed a linear decrease in fluorescence that was due to either the bleaching of the signal or myofibril settling, which was subtracted from the experimental traces. Buffer conditions were identical to those described for panel A. Panel C shows the dose-dependent effect that increasing ATP had on the apparent fast rate of cross-bridge detachment from Ca2+-free TnCIANBDT53C rabbit myofibrils. The inset shows the transmitted light microscopy image of the myofibrils after being mixed with 50 μm ATP in the stopped flow. Panel D shows the effect that increasing ADP had on the apparent fast rate of cross-bridge detachment of Ca2+-free TnCIANBDT53C rabbit myofibrils. Increasing concentrations of ADP (0–2000 μm) were added to the Ca2+-free TnCIANBDT53C myofibrils in Buffer A + 5 mm EGTA and rapidly mixed against Buffer A + 5 mm EGTA + 2 mm ATP at 15 °C. Both the concentrations of ATP and ADP shown in panels C and D were the final concentration after mixing in the stopped-flow. The top inset shows the transmitted light microscopy image of the myofibrils after being mixed with 2 mm ATP in the stopped flow. The bottom inset shows an enlarged myofibril from this population.
FIGURE 5.
FIGURE 5.
Cross-bridge detachment rates from varying species of myofibrils. Panel A displays the rates of cross-bridge detachment in the absence of ADP at 15 °C from failing human (41 ± 4/s), dog (125 ± 17/s), rabbit (163 ± 8/s), and rat ventricular myofibrils (159 ± 6/s) that were exchanged with TnCIANBDT53C Tn. The TnCIANBDT53C myofibrils in Buffer A + 5 mm EGTA were rapidly mixed with equal volumes of the Buffer A + 5 mm EGTA + 2 mm ATP. Panel B displays the rates of cross-bridge detachment in the presence of 2 mm ADP from failing human (2.3 ± 0.3/s), dog (6.3 ± 0.6/s), rabbit (6.9 ± 0.6/s), and rat ventricular myofibrils (42 ± 3/s) that were exchanged with TnCIANBDT53C Tn at 15 °C. TnCIANBDT53C myofibrils in Buffer A + 5 mm EGTA + 2 mm ADP were rapidly mixed with equal volumes of Buffer A + 5 mm EGTA + 2 mm ATP.
FIGURE 6.
FIGURE 6.
Effect of slowed cross-bridge detachment on the rate of Ca2+ dissociation from rabbit myofibrils. Panel A represents the biphasic kinetic trace for TnCIANBDT53C myofibrils in Buffer A + 200 μm Ca2+ + 2 mm ADP when mixed with an equal amount of Buffer A + 10 mm EGTA and 2 mm ATP at 15 °C (Myofibrils + ADP versus EGTA + ATP trace, biphasic). The Ca2+-free myofibrils + ADP versus ATP trace from Fig. 3, panel B (6.9 ± 0.6/s), was shown for a graphic comparison. Panel B shows the effect that ADP and cross-linking had on the rate of Ca2+ dissociation at 15 °C. The Ca2+-free myofibrils + ADP versus ATP trace (panel A) was subtracted from the biphasic myofibrils + ADP versus EGTA + ATP trace (panel A) to recover the Ca2+ dissociation signal (subtraction, ∼ 25/s). TnCIANBDT53C myofibrils in Buffer A + 200 μm Ca2+ + 2 mm ADP were rapidly mixed with an equal volume of the Buffer A + 10 mm EGTA at 15 °C (Myofibril + ADP versus EGTA trace, 24 ± 1/s). Cross-linked TnCIANBDT53C myofibrils in Buffer A + 200 μm Ca2+ were rapidly mixed with an equal volume of the Buffer A + 10 mm EGTA + 2 mm ATP (Cross-linked Myofibrils versus EGTA + ATP trace, 22 ± 1/s).
FIGURE 7.
FIGURE 7.
Effect of temperature on the rates of Ca2+ dissociation and cross-bridge detachment as reported by TnC in rabbit myofibrils. Panel A shows the comparison between the rates of rigor Ca2+ dissociation (△), cross-bridge detachment + 2 mm ADP (○), and maximal proposed rate of ADP dissociation (□) at increasing temperatures (* denotes calculated value). Rigor Ca2+ dissociation (△) was determined by mixing TnCIANBDT53C myofibrils in Buffer A + 200 μm Ca2+ with an equal volume of the Buffer A + 10 mm EGTA. The Cross-Bridge Detachment (No ADP) plot (inset, □) represents cross-bridge detachment from ADP free myofibrils. Cross-bridge detachment in presence of ADP was determined by mixing TnCIANBDT53C myofibrils in Buffer A + 5 mm EGTA + 2 mm ADP (○) with an equal volume of the Buffer A + 5 mm EGTA + 2 mm ATP. The shaded area is used to highlight the difference between the maximal proposed rate of ADP dissociation to that with 2 mm ADP. Panel B shows the effect that increasing ADP had on the apparent fast rate of cross-bridge detachment of Ca2+-free TnCIANBDT53C rabbit myofibrils at 35 °C. Increasing concentrations of ADP (0–2000 μm) were added to the Ca2+-free TnCIANBDT53C myofibrils in Buffer A + 5 mm EGTA and rapidly mixed against Buffer A + 2 mm ATP at 35 °C. The concentrations of ADP shown were the final concentration after mixing in the stopped-flow.

References

    1. Grossman W. (1990) Diastolic function and heart failure. An overview. Eur. Heart J. 11, 2–7 - PubMed
    1. Janssen P. M., Periasamy M. (2007) Determinants of frequency-dependent contraction and relaxation of mammalian myocardium. J. Mol. Cell. Cardiol. 43, 523–531 - PMC - PubMed
    1. Bers D. M. (2002) Cardiac excitation-contraction coupling. Nature 415, 198–205 - PubMed
    1. Janssen P. M., Stull L. B., Marbán E. (2002) Myofilament properties comprise the rate-limiting step for cardiac relaxation at body temperature in the rat. Am. J. Physiol. Heart Circ. Physiol. 282, H499–H507 - PubMed
    1. Backx P. H., Gao W. D., Azan-Backx M. D., Marban E. (1995) The relationship between contractile force and intracellular [Ca2+] in intact rat cardiac trabeculae. J. Gen. Physiol. 105, 1–19 - PMC - PubMed

Publication types

LinkOut - more resources