. 2012 Sep;86(17):9285-96.
doi: 10.1128/JVI.00712-12. Epub 2012 Jun 20.

Roles of cell signaling pathways in cell-to-cell contact-mediated Epstein-Barr virus transmission

Affiliations

Roles of cell signaling pathways in cell-to-cell contact-mediated Epstein-Barr virus transmission

Asuka Nanbo et al. J Virol. 2012 Sep.

Abstract

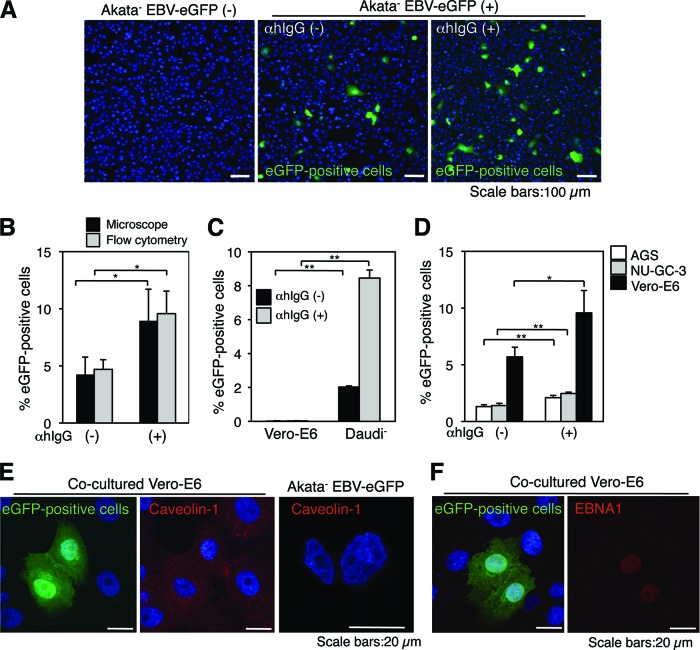
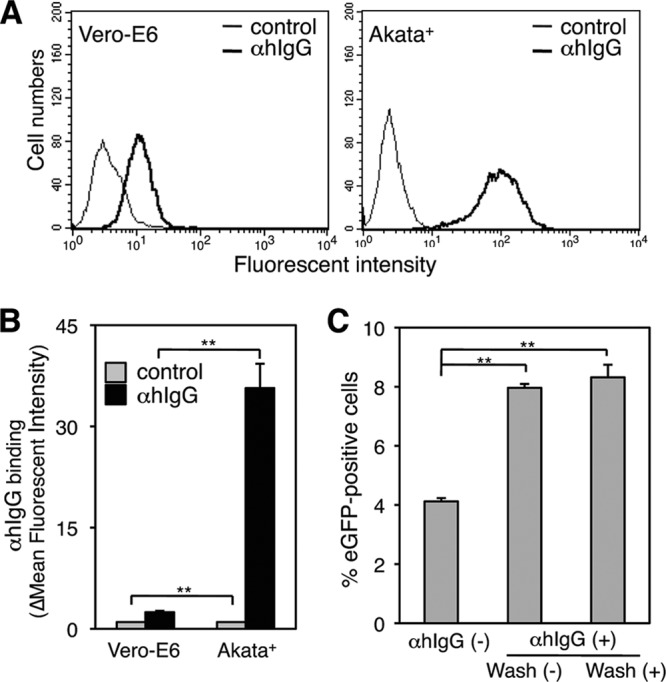
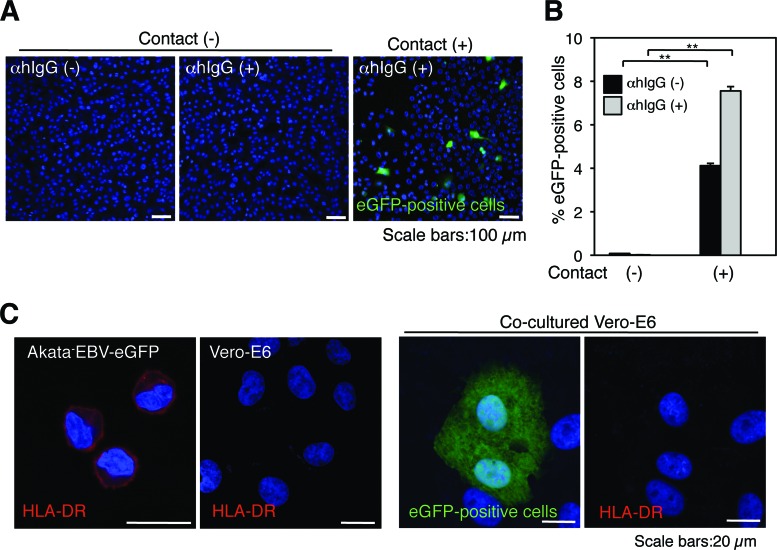
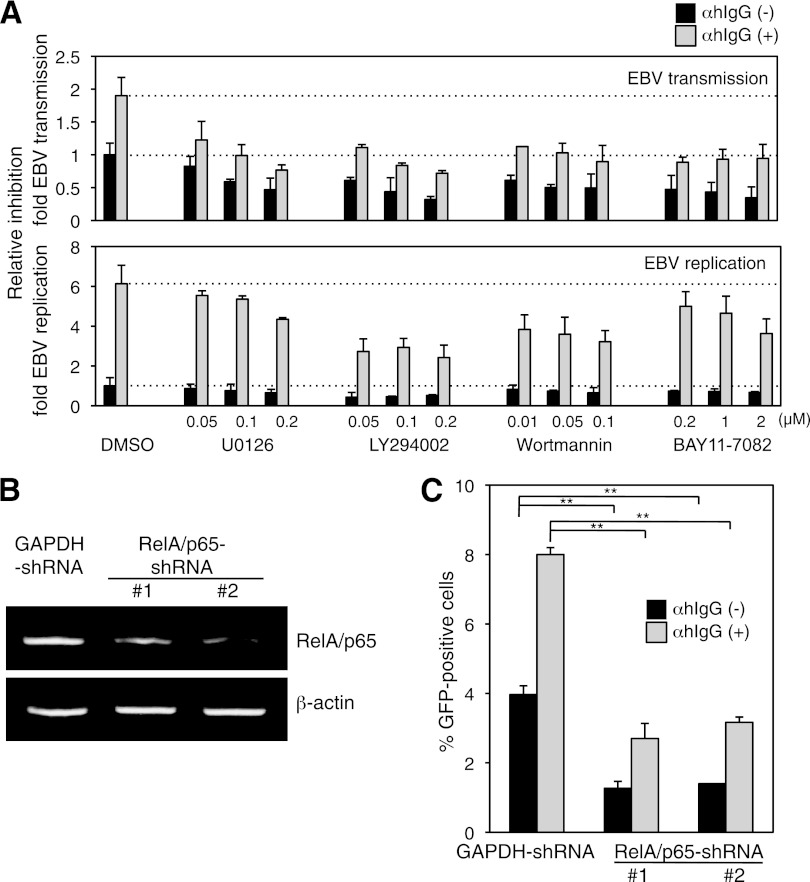
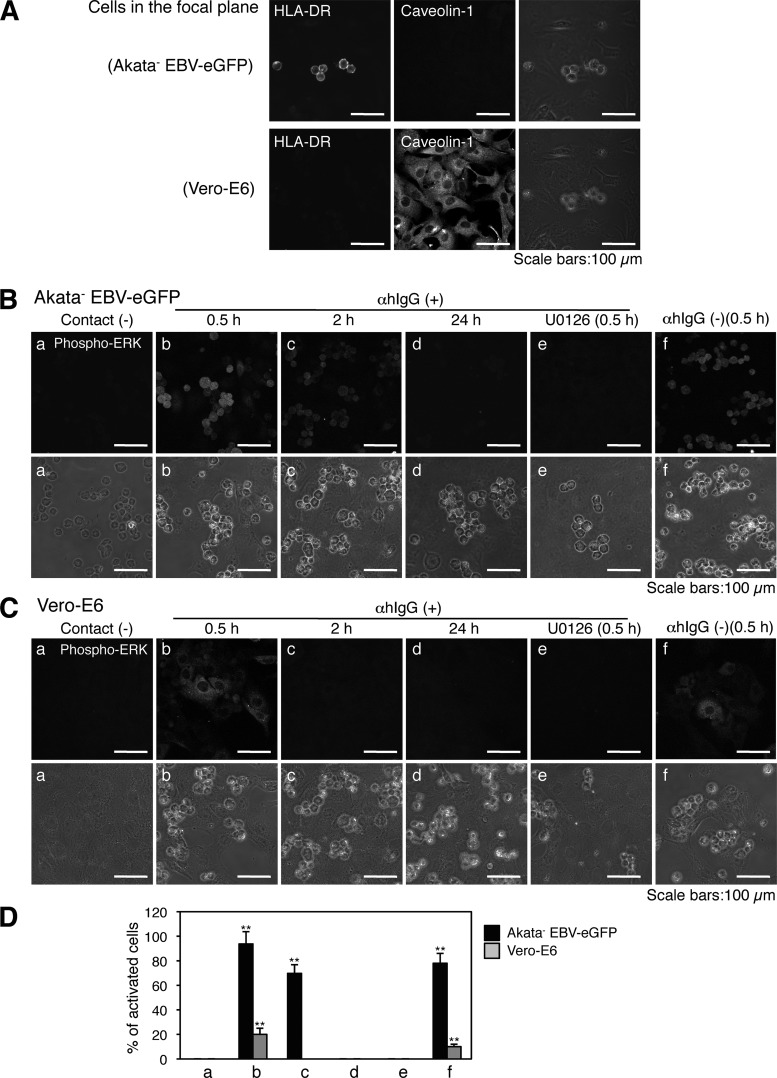
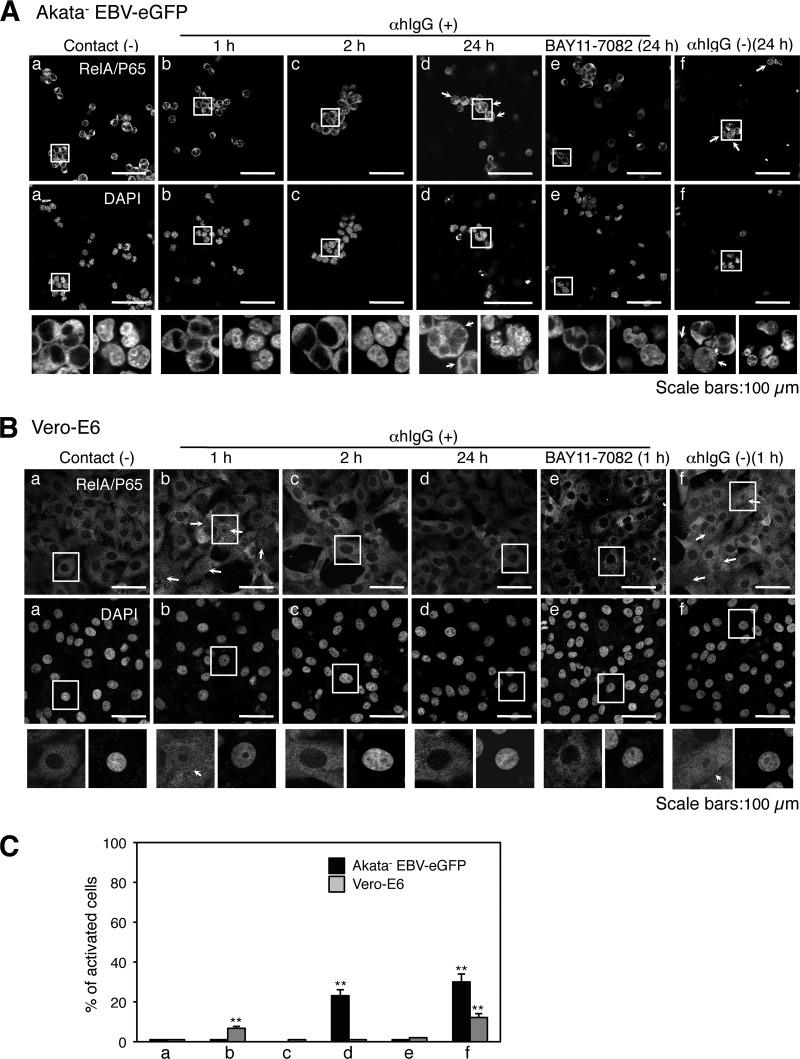
Epstein-Barr virus (EBV), a human gamma herpesvirus, establishes a life-long latent infection in B lymphocytes and epithelial cells following primary infection. Several lines of evidence indicate that the efficiency of EBV infection in epithelial cells is accelerated up to 10(4)-fold by coculturing with EBV-infected Burkitt's lymphoma (BL) cells compared to infection with cell-free virions, indicating that EBV infection into epithelial cells is mainly mediated via cell-to-cell contact. However, the molecular mechanisms involved in this pathway are poorly understood. Here, we establish a novel assay to assess cell-to-cell contact-mediated EBV transmission by coculturing an EBV-infected BL cell line with an EBV-negative epithelial cell line under stimulation for lytic cycle induction. By using this assay, we confirmed that EBV was transmitted from BL cells to epithelial cells via cell-to-cell contact but not via cell-to-cell fusion. The inhibitor treatments of extracellular signal-regulated kinase (ERK) and nuclear factor (NF)-κB pathways blocked EBV transmission in addition to lytic induction. The blockage of the phosphoinositide 3-kinase (PI3K) pathway impaired EBV transmission coupled with the inhibition of lytic induction. Knockdown of the RelA/p65 subunit of NF-κB reduced viral transmission. Moreover, these signaling pathways were activated in cocultured BL cells and in epithelial cells. Finally, we observed that viral replication was induced in cocultured BL cells. Taken together, our data suggest that cell-to-cell contact induces multiple cell signaling pathways in BL cells and epithelial cells, contributing to the induction of the viral lytic cycle in BL cells and the enhancement of viral transmission to epithelial cells.


Figures

Fig 1
Fig 1
EBV is transmitted from BL cells to epithelial cells by cocultivation. (A) EBV transmission from BL cells to epithelial cells is facilitated by αhIgG treatment. Vero-E6 cells were cocultured with Akata EBV-eGFP cells in the absence (middle) or presence (right) of αhIgG for 24 h. The infection of EBV-eGFP in Vero-E6 cells (green) was analyzed by a confocal laser scanning microscope. The left panel shows the result without cocultivation. The nucleus was counterstained with DAPI. Scale bars, 100 μm. (B) A summary of cell-to-cell contact-mediated EBV transmission. Vero-E6 cells were cocultured with Akata EBV-eGFP cells in the absence or presence of αhIgG for 24 h. The percentages of EBV-eGFP-positive Vero-E6 cells were analyzed by a confocal laser scanning microscope (black bars) or flow cytometry (gray bars). The experiment was performed five times independently, and the averages and standard deviations are shown for each condition. *, P < 0.05 versus the respective control (Student's t test). (C) Infection of cell-free EBV-eGFP into Vero-E6 cells. Vero-E6 cells or Daudi cells were incubated for 1 h at 37°C with culture supernatants derived from αhIgG-treated (gray bars) or untreated (black bars) Akata EBV-eGFP cells. The culture supernatants were replaced with fresh medium, and the cells were further incubated for 48 h. The percentages of eGFP-positive cells were analyzed by flow cytometry. The experiment was performed three times independently. The averages and standard deviations are shown for each condition. **, P < 0.01 versus the respective control (Student's t test). (D) EBV-eGFP is transmitted to human gastric epithelial cells. AGS (white bars), NU-GC-3 (gray bars), or Vero-E6 (black bars) cells were cocultured with Akata EBV-eGFP cells in the absence or presence of αhIgG for 24 h. The percentages of eGFP-positive epithelial cells were analyzed by flow cytometry. The experiment was performed three times independently, and the averages and standard deviations are shown for each condition. *, P < 0.05 versus the respective control. **, P < 0.01 versus the respective control (Student's t test). (E) EBV-eGFP is transmitted to Vero-E6 cells. Vero-E6 cells were cocultured with Akata EBV-eGFP cells under the treatment of αhIgG for 24 h. The expression of an epithelium marker, caveolin-1, was analyzed by immunofluorescent staining. Caveolin-1 (red; middle) was expressed in eGFP-positive cells (green; left); BL-derived Akata EBV-eGFP cells were caveolin-1 negative (right). The nucleus was counterstained with DAPI. Scale bars, 20 μm. (F) eGFP-positive Vero-E6 cells are infected with EBV-eGFP. Vero-E6 cells were cocultured with Akata EBV-eGFP cells under treatment with αhIgG for 24 h. The expression of EBV-encoded nuclear antigen 1 (EBNA1) was analyzed by immunofluorescent staining. eGFP-positive Vero-E6 cells (green; left) were EBNA1 positive (red; right). The nucleus was counterstained with DAPI. Scale bars, 20 μm.
Fig 2
Fig 2
Role of free αhIgG in viral transmission. (A) The binding of αhIgG to Vero-E6. Vero-E6 cells (left) or Akata+ cells (right) were incubated with 0.1% αhIgG on ice. The binding of αhIgG was revealed with FITC-labeled secondary antibody (boldface lines) by flow cytometry. As a control, cells were incubated with the secondary antibody (thin lines). (B) Summary of binding of αhIgG. The efficiency of binding of αhIgG to Vero-E6 or Akata+ cells was quantified by flow cytometry (black bars). As a control, cells were incubated with the secondary antibody (gray bars). The experiment was performed three times independently, and the averages and standard deviations are shown for each condition. **, P < 0.01 versus the respective control (Student's t test). (C) The role of free αhIgG in viral transmission. Akata EBV-eGFP cells were treated with αhIgG for 2 h, washed to remove free αhIgG, and cocultured with Vero-E6 cells for 24 h. The percentage of eGFP-positive epithelial cells was analyzed by flow cytometry. As a control, Akata EBV-eGFP cells were cocultured with Vero-E6 cells in the presence of free αhIgG. The experiment was performed three times independently, and the averages and standard deviations are shown for each condition. **, P < 0.01 versus the respective control (Student's t test).
Fig 3
Fig 3
EBV is transmitted from BL cells to epithelial cells via cell-to-cell contact. (A) Physical cell-to-cell contact is required for EBV transmission. Vero-E6 cells were grown in the basolateral chamber of transculture inserts with pore sizes of 0.4 μm. Akata EBV-eGFP cells were added to the inserts and incubated in the presence (left) or absence (middle) of αhIgG for 24 h. As a control, Vero-E6 cells were cocultured with Akata EBV-eGFP in the presence of αhIgG (right). The infection of EBV-eGFP into Vero-E6 (green) was analyzed by a confocal laser scanning microscope. The nucleus was counterstained with DAPI. Scale bars, 100 μm. (B) A summary of viral transmission with a physical barrier. Vero-E6 cells were grown in the basolateral chamber of transculture plates. Akata EBV-eGFP cells were added to the inserts and incubated in the presence (gray bars) or absence (black bars) of αhIgG for 24 h. As a control, Vero-E6 cells were cocultured with Akata EBV-eGFP in the presence (gray bars) or absence (black bars) of αhIgG. The infection of EBV-eGFP in Vero-E6 cells was analyzed by flow cytometry. The experiment was performed three times independently. The averages and standard deviations are shown for each condition. **, P < 0.01 versus the respective control (Student's t test). (C) EBV transmits from BL cells to epithelial cells via cell-to-cell contact. Akata EBV-eGFP cells were cocultured with Vero-E6 cells in the presence of αhIgG for 24 h. The expression of HLA-DR (red) in Akata EBV-eGFP or Vero-E6 cells was analyzed by immunofluorescent staining (left panels). HLA-DR (red) was expressed in eGFP-positive Vero-E6 cells (green) (right panels). The nucleus was counterstained with DAPI. Scale bars, 20 μm.
Fig 4
Fig 4
Effect of the inhibitors of cell signaling pathways on cell-to-cell contact-mediated EBV transmission and replication. (A) The effect of the inhibitors on cell-to-cell contact-mediated EBV transmission (top) and EBV replication (bottom). Vero-E6 cells were cocultured with Akata EBV-eGFP cells in the presence (gray bars) or absence (black bars) of αhIgG under treatment with DMSO, U0126, LY294002, wortmannin, or BAY11-7082 for 24 h. The percentages of eGFP-positive cells were analyzed by flow cytometry. The data were normalized to untreated and DMSO-treated cells (top). Cocultured Akata EBV-eGFP cells were harvested, and the expression of gp350 was analyzed by flow cytometry. The data were normalized to αhIgG-untreated and DMSO-treated cells (bottom). The experiment was performed three times independently. The averages and standard deviations are shown for each condition. (B) RelA/p65 knockdown by shRNA in Vero-E6 cells. Total RNA was isolated from two Vero-E6 clones stably expressing shRNA against human NF-κB RelA/p65 (RelA/p65-shRNAs 1 and 2) and a control expressing shRNA against human glyceraldehyde-3-phosphate dehydrogenase (GAPDH-shRNA). Knockdown of RelA/p65 mRNA was analyzed by RT-PCR (top). As a control, the expression of β-actin mRNA is shown (bottom). (C) The effect of RelA/p65 knockdown on cell-to-cell contact-mediated EBV transmission. RelA/p65-shRNA or GAPDH-shRNA was cocultured with Akata EBV-eGFP cells in the presence (gray bars) or absence (black bars) of αhIgG for 24 h. Viral transmission was assessed by flow cytometry. The experiment was performed three times independently. The averages and standard deviations are shown for each condition. **, P < 0.01 versus the respective control (Student's t test).
Fig 5
Fig 5
Activation of the ERK pathway in cocultured cells. (A) Immunofluorescent staining analysis in cocultured cells. Vero-E6 cells grown in 35-mm glass-bottomed culture dishes were cocultured with Akata EBV-eGFP cells for 4 h. The cells were harvested and subjected to immunofluorescent staining to analyze the expression of HLA-DR in Akata EBV-eGFP cells (top left) or caveolin-1 in Vero-E6 cells (bottom middle) under cocultured conditions. The bright-field images are shown (right). Scale bars, 100 μm. ERK is phosphorylated in cocultured Akata EBV-eGFP (B) or Vero-E6 cells (C). Vero-E6 cells were cocultured with Akata EBV-eGFP cells in the presence (b to e) or absence (f) of αhIgG for various times. The phosphorylation of ERK in Akata EBV-eGFP (B) or Vero-E6 (C) cells was examined by immunofluorescent staining (top). The effect of U0126 treatment (0.2 μM) on the phosphorylation of ERK is shown in image e. As a control, the status of ERK phosphorylation in untreated Akata EBV-eGFP or Vero-E6 cells is shown in image a. Bright-field images are shown at the bottom. Scale bars, 100 μm. (D) The percentages of the cells positive for the phosphorylation of ERK were analyzed by a confocal laser scanning microscope. The experiment was performed three times independently. The averages and standard deviations are shown for each condition. **, P < 0.01 versus the respective control (Student's t test).
Fig 6
Fig 6
Activation of the PI3K pathway in cocultured cells. Akt is phosphorylated in cocultured Akata EBV-eGFP (A) or Vero-E6 (B) cells. Vero-E6 cells were cocultured with Akata EBV-eGFP cells in the presence (b to f) or absence (g) of αhIgG for various times. The phosphorylation of Akt in Akata EBV-eGFP (A) or Vero-E6 (B) cells was examined by immunofluorescent staining (top). The effect of LY294002 treatment (0.2 μM) (e) or wortmannin treatment (0.1 μM) (f) on the phosphorylation of Akt is shown. As a control, the status of Akt phosphorylation in Akata EBV-eGFP or Vero-E6 cells not treated with αhIgG is shown in image a. Bright-field images are shown (bottom). Scale bars, 100 μm. (C) The percentages of the cells exhibiting phosphorylation of Akt were analyzed by a confocal laser scanning microscope. The experiment was performed three times independently. The averages and standard deviations are shown for each condition. **, P < 0.01 versus the respective control (Student's t test).
Fig 7
Fig 7
Activation of the NF-κB pathway in cocultured cells. The nuclear translocation of RelA/p65 in cocultured Akata EBV-eGFP (A) or Vero-E6 (B) cells. Vero-E6 cells were cocultured with Akata EBV-eGFP cells in the presence (b to e) or absence (f) of αhIgG for various times. The translocation of RelA/p65 in Akata EBV-eGFP (A) or Vero-E6 (B) cells was examined by immunofluorescent staining (top). The effect of BAY11-7082 treatment (2 μM) on the translocation of RelA/p65 is shown in image e. As a control, the status of RelA/p65 translocation in Akata EBV-eGFP or Vero-E6 cells not treated with αhIgG is shown in image a. The nucleus is counterstained with DAPI (bottom). Insets show enlargements of the boxed areas. Scale bars, 100 μm. (C) The percentages of the cells that contain the translocation of RelA/p65 were analyzed by a confocal laser scanning microscope. The experiment was performed three times independently. The averages and standard deviations are shown for each condition. **, P < 0.01 versus the respective control (Student's t test).
Fig 8
Fig 8
Lytic cycle is induced in cocultured BL cells. (A) Vero-E6 cells were cocultured with Akata EBV-eGFP cells in the absence of αhIgG for 24 h (top, right). As a control, Akata EBV-eGFP cells were treated in the presence (top middle) or absence of αhIgG (top left). Akata EBV-eGFP cells were harvested, and the induction of the lytic cycle was analyzed by FISH using Cy3-labeled probe for the EBV genome (top). Enlarged images of the cell in latent (bottom left) or lytic (bottom right) phase are shown. The nucleus was counterstained with DAPI. Scale bars, 100 μm. (B) The percentages of Akata EBV-eGFP cells undergoing the lytic cycle were analyzed by a confocal laser scanning microscope. The experiment was performed three times independently. The averages and standard deviations are shown for each condition. **, P < 0.01 versus the respective control (Student's t test). (C) The expression of gp350 in cocultured BL cells. The expression of gp350 was analyzed by flow cytometry. The experiment was performed three times independently. The averages and standard deviations are shown for each condition. **, P < 0.01 versus the respective control (Student's t test).

Similar articles

Cited by

References

    1. Akiyama S, et al. 1988. Characteristics of three human gastric cancer cell lines, NU-GC-2, NU-GC-3 and NU-GC-4. Jpn. J. Surg. 18:438–446 - PubMed
    1. Barranco SC, et al. 1983. Establishment and characterization of an in vitro model system for human adenocarcinoma of the stomach. Cancer Res. 43:1703–1709 - PubMed
    1. Boulton TG, et al. 1991. ERKs: a family of protein-serine/threonine kinases that are activated and tyrosine phosphorylated in response to insulin and NGF. Cell 65:663–675 - PubMed
    1. Brown HJ, et al. 2003. NF-kappaB inhibits gammaherpesvirus lytic replication. J. Virol. 77:8532–8540 - PMC - PubMed
    1. Chang Y, et al. 1999. Requirement for cell-to-cell contact in Epstein-Barr virus infection of nasopharyngeal carcinoma cells and keratinocytes. J. Virol. 73:8857–8866 - PMC - PubMed

Publication types

MeSH terms

Substances

LinkOut - more resources