. 2012 Aug;23(16):3178-92.
doi: 10.1091/mbc.E11-06-0509. Epub 2012 Jun 20.

Differential recognition of a dileucine-based sorting signal by AP-1 and AP-3 reveals a requirement for both BLOC-1 and AP-3 in delivery of OCA2 to melanosomes

Affiliations

Differential recognition of a dileucine-based sorting signal by AP-1 and AP-3 reveals a requirement for both BLOC-1 and AP-3 in delivery of OCA2 to melanosomes

Anand Sitaram et al. Mol Biol Cell. 2012 Aug.

Abstract

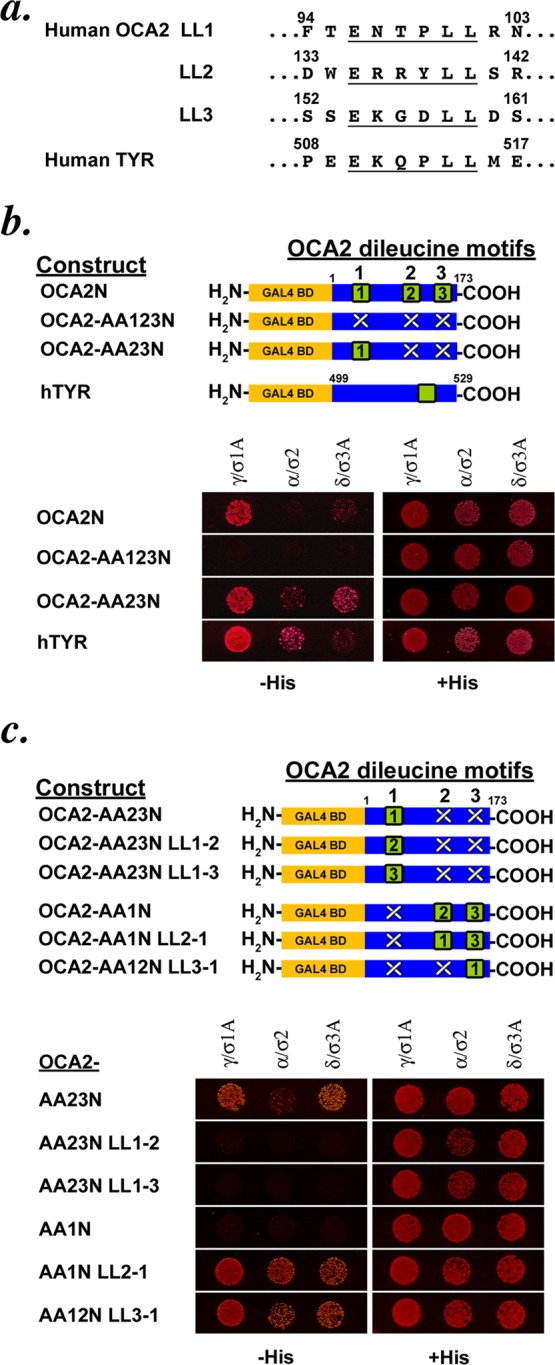
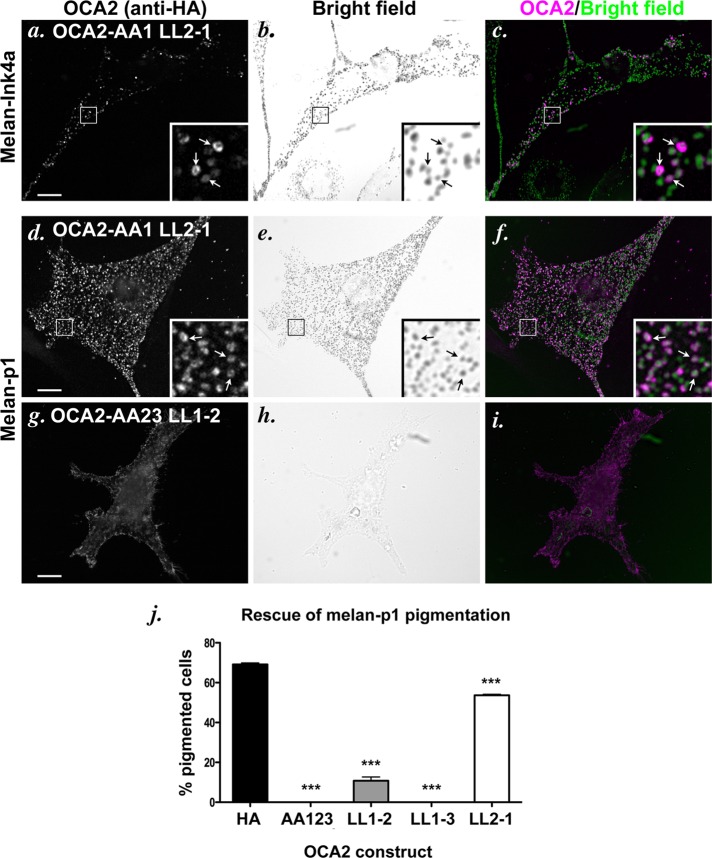
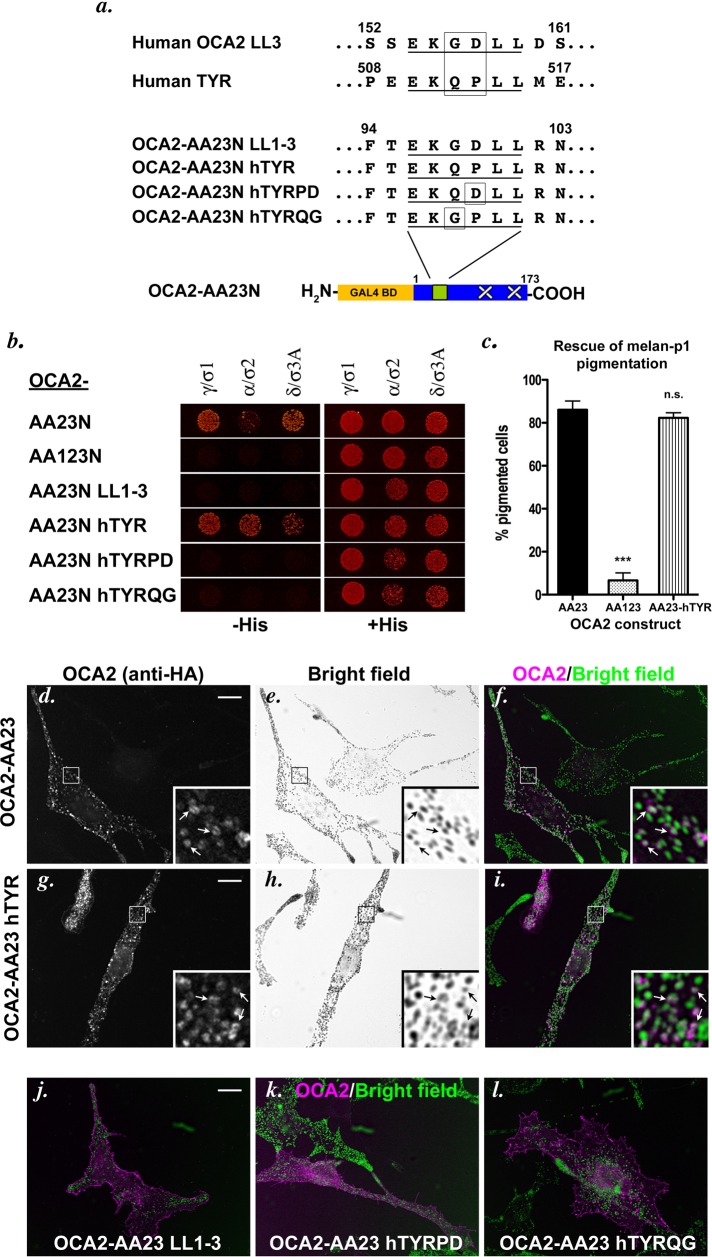
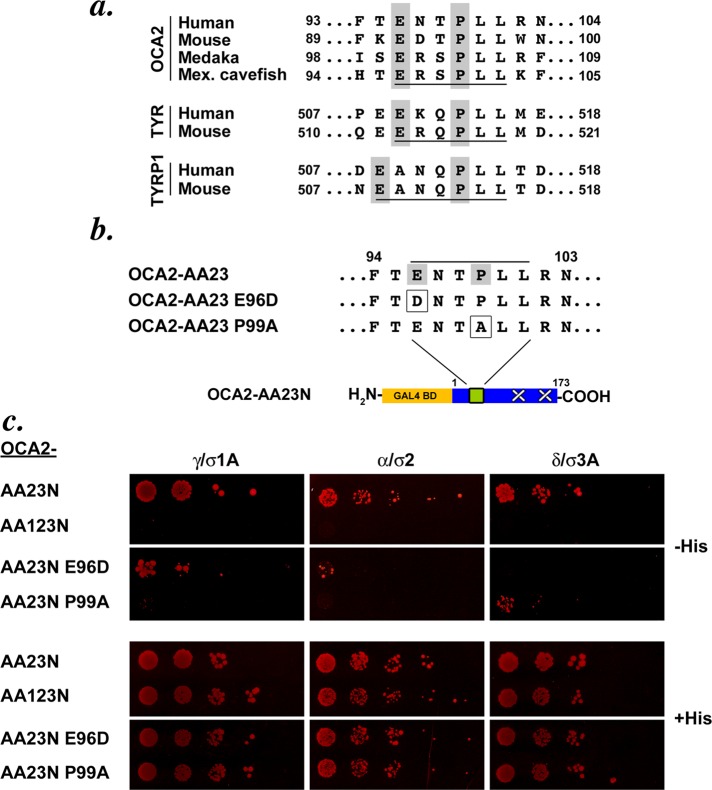
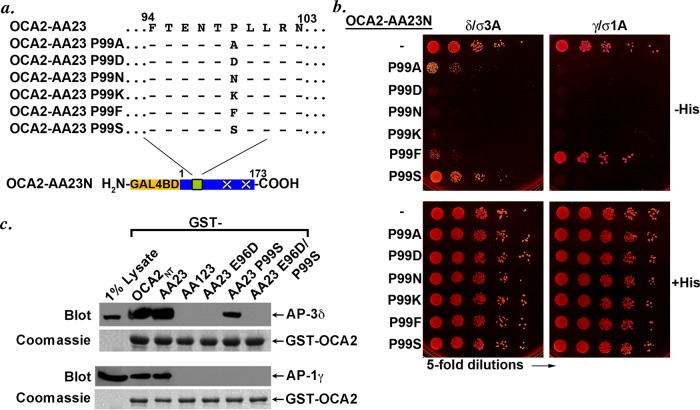
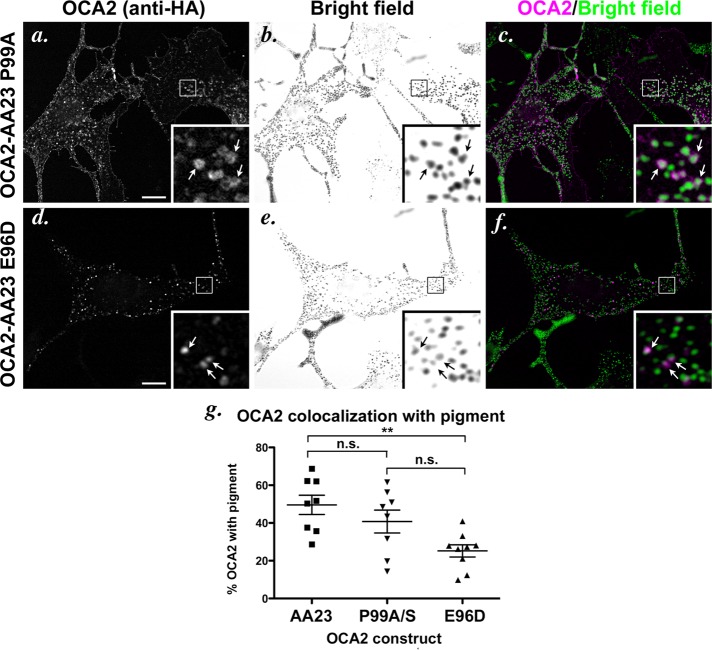
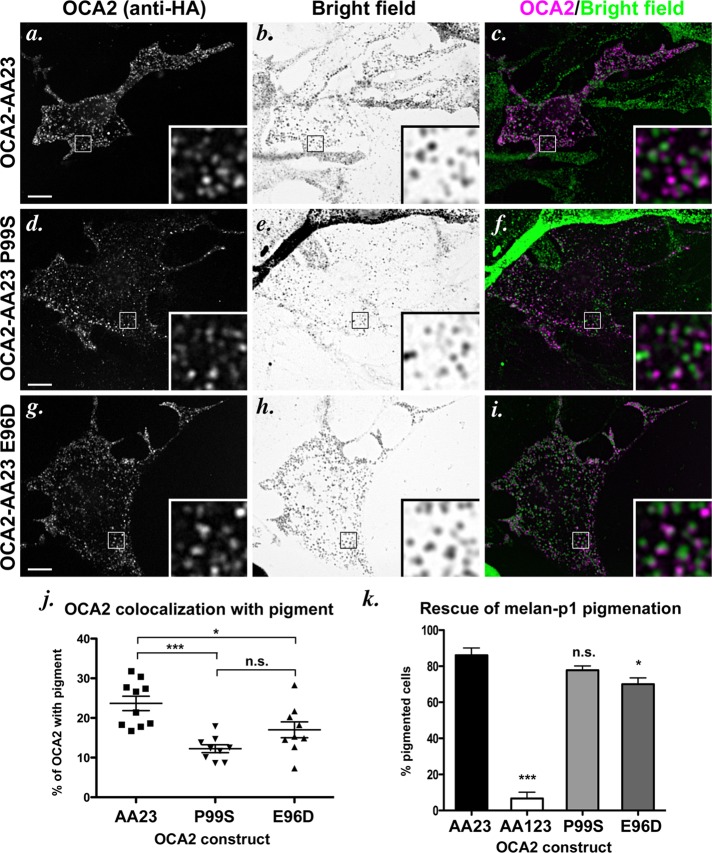
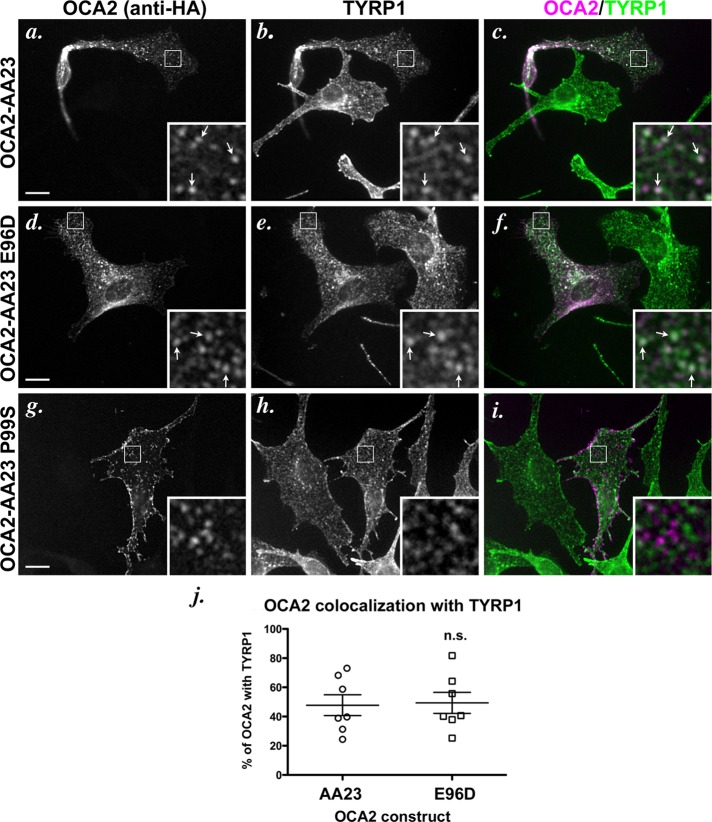
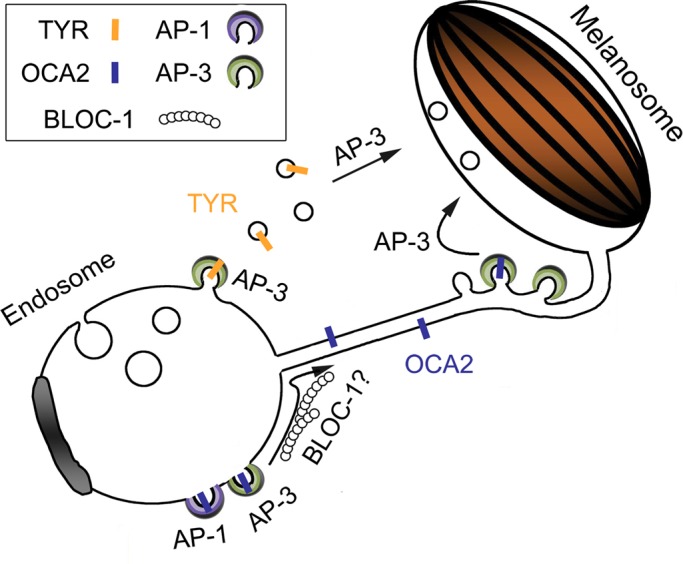
Cell types that generate unique lysosome-related organelles (LROs), such as melanosomes in melanocytes, populate nascent LROs with cargoes that are diverted from endosomes. Cargo sorting toward melanosomes correlates with binding via cytoplasmically exposed sorting signals to either heterotetrameric adaptor AP-1 or AP-3. Some cargoes bind both adaptors, but the relative contribution of each adaptor to cargo recognition and their functional interactions with other effectors during transport to melanosomes are not clear. Here we exploit targeted mutagenesis of the acidic dileucine-based sorting signal in the pigment cell-specific protein OCA2 to dissect the relative roles of AP-1 and AP-3 in transport to melanosomes. We show that binding to AP-1 or AP-3 depends on the primary sequence of the signal and not its position within the cytoplasmic domain. Mutants that preferentially bound either AP-1 or AP-3 each trafficked toward melanosomes and functionally complemented OCA2 deficiency, but AP-3 binding was necessary for steady-state melanosome localization. Unlike tyrosinase, which also engages AP-3 for optimal melanosomal delivery, both AP-1- and AP-3-favoring OCA2 variants required BLOC-1 for melanosomal transport. These data provide evidence for distinct roles of AP-1 and AP-3 in OCA2 transport to melanosomes and indicate that BLOC-1 can cooperate with either adaptor during cargo sorting to LROs.


Figures

FIGURE 1:
FIGURE 1:
The cytoplasmic domain of OCA2 shows dileucine-dependent interaction with adaptor proteins in a yeast three-hybrid system. (a) Sequences of the three acidic dileucine sorting motifs in the cytoplasmic N-terminus of human OCA2 and the single acidic dileucine motif in the cytoplasmic C-terminus of human tyrosinase. (b) Schematic of OCA2 N-terminal-domain Gal4 fusion constructs used in the assay. GAL4 BD, Gal4-binding domain; green square, intact dileucine motif; white X, disrupted dileucine motif. Black numbers within the green square indicate whether the primary sequence of the LL1, LL2, or LL3 motif is inserted at the indicated position within the domain. Below, a yeast three-hybrid assay of various OCA2 constructs coexpressed with hemicomplexes of the AP-1 (γ/σ1A), AP-2 (α/σ2), and AP-3 (δ/σ3A) complexes. A protein–protein interaction leads to expression of HIS3, allowing growth on His-deficient medium. All transformed yeast grow on His-containing control medium. (c) Schematic of OCA2 constructs used in the assay. Below, yeast three-hybrid assay of the OCA2 constructs in which dileucine motif sequences are repositioned within the OCA2 cytoplasmic domain.
FIGURE 2:
FIGURE 2:
Localization and function of OCA2 dileucine-motif position mutants. (a–i) IFM analysis of melan-Ink4a cells (a–c) or melan-p1 cells (d–i) expressing selected mutant OCA2 variants. The melan-Ink4a melanocytes were transfected with OCA2-AA1 LL2-1 (a–c), and the melan-p1 cells were transfected with OCA2-AA1 LL2-1 (d–f) or OCA2-AA23 LL1-2 (g–i). Transgenes were visualized with anti-HA antibodies (a, d, g), and melanosomes were visualized by bright-field microscopy (b, e, h). c, f, and i are merged OCA2-HA (magenta) and inverted bright-field (green) images. All insets show 5× magnified images of the boxed region. Arrows point to regions of overlap of OCA2 constructs with melanosomes. Bar, 10 μm. (j) Dileucine mutants were expressed in OCA2-deficient melan-p1 cells, and transfected cells were visually inspected for the presence of pigmented melanosomes. Shown is the percentage of transfected cells expressing each indicated construct that contained pigmented melanosomes (percentage pigmented cells). All columns were significantly different from rescue by OCA2-HA. ***, p < 0.001.
FIGURE 3:
FIGURE 3:
Internal sorting signal residues affect AP complex interaction. (a) Comparison of the LL3 acidic dileucine motif from human OCA2 and the sole acidic dileucine motif in human tyrosinase. OCA2-AA23N hTYR constructs were made in which the first acidic dileucine motif of the OCA2 cytoplasmic domain was replaced with the sequence from tyrosinase, with or without the indicated amino acid substitutions. (b) Yeast three-hybrid analyses of AP hemicomplex interaction with the OCA2-AA23N hTYR constructs. (c) Melan-p1 rescue assay performed as in Figure 2j. n.s., not significant. ***, p < 0.001. (d–l) Melan-Ink4a mouse melanocytes were transiently transfected with full-length, HA-tagged OCA2-AA23 (d–f), OCA2-AA23 hTYR (g–i), OCA2-AA23 LL1-3 (j), OCA2-AA23 hTYRPD (k), or OCA2-AA23 hTYRQG (l) constructs bearing the identical mutations used in the yeast three-hybrid assay. Cells were stained with anti-HA antibodies (d, g; colored magenta in merged pictures, f, i–l) and subjected to indirect immunofluorescence microscopy. Bright-field images (e, h) were inverted and colored green in merged pictures. Arrows point to regions of overlap between OCA2 constructs and melanosomes. Bar, 10 μm.
FIGURE 4:
FIGURE 4:
AP-1 and AP-3 interaction with the OCA2 LL1 motif are separable. (a) Comparison of sequences of acidic dileucine motifs in OCA2 isoforms from human, mouse, Japanese medaka fish, and Mexican cavefish. All motifs are underlined, and gray boxes highlight conserved elements in the OCA2 motifs, as well as in motifs from human and mouse tyrosinase and TYRP1. (b) Single amino acid substitutions were made in the OCA2-AA23N construct to test for changes in interaction with AP complexes. (c) Yeast three-hybrid analyses of AP interaction with OCA2 sorting motif mutants. Transformants were spotted in fivefold serial dilutions. E96D and P99A show reciprocal interaction with AP-1 and AP-3.
FIGURE 5:
FIGURE 5:
AP-3 is more tolerant than AP-1 of substitutions at the −1 position in the OCA2 LL1 sorting motif. (a) Schematic of OCA2-AA23N constructs containing a range of amino acid substitutions at the conserved proline of the LL1 sorting motif of human OCA2. (b) Yeast three-hybrid analyses of the interaction of OCA2-AA23N proline substitution constructs with AP-3 or AP-1. (c) GST pull-down assay. Fusion proteins consisting of GST fused to the full-length OCA2 N-terminal cytoplasmic domain (GST-OCA2NT) or to the indicated mutants were generated by expression in E. coli, bound to glutathione–Sepharose beads and incubated with detergent lysates of the human melanoma, MNT-1. Bound proteins were recovered by centrifugation, fractionated by SDS–PAGE, and analyzed by immunoblotting for AP-3 (with anti–δ-adaptin antibody) or AP-1 (with anti–γ-adaptin antibody). Bottom, Coomassie stain of the same gels showing equal loading of GST-OCA2 cytoplasmic domains.
FIGURE 6:
FIGURE 6:
Localization of dileucine-motif point mutants in wild-type melanocytes. (a–f) IFM analysis of melan-Ink4a cells expressing selected mutant OCA2 variants. Melan-Ink4a melanocytes were transfected with OCA2-AA23 P99A (a–c) or OCA2-AA23 E96D (d–f). Transgenes were visualized with anti-HA antibodies (a, d), and melanosomes were visualized by bright-field microscopy (b, e). c and f are merged OCA2-HA (magenta) and inverted bright-field (green) images. All insets show 5× magnified images of the boxed region. Arrows point to regions of overlap of OCA2 constructs with melanosomes. Bar, 10 μm. (g) Deconvolved IFM images of each mutant were converted to binary images and analyzed for marker overlap. Cells transfected with OCA2-AA23 P99A or OCA2-AA23 P99S were combined in the analysis. Each data point represents one cell. Shown is the percentage of punctate/vesicular HA staining that overlapped with pigment in each cell (percentage of OCA2 with pigment). Each pair of mutants was compared. n.s., not significant. **, p < 0.01.
FIGURE 7:
FIGURE 7:
Localization of dileucine-motif point mutants in AP-3–deficient melanocytes. (a–i) IFM analysis of AP-3–deficient cells expressing selected mutant OCA2 variants. Melan-pe melanocytes were transfected with OCA2-AA23 (a–c), OCA2-AA23 P99S (d–f), or OCA2-AA23 E96D (g–i). Transgenes were visualized with anti-HA antibodies (a, d, g), and melanosomes were visualized by bright-field microscopy (b, e, h). c, f, and i are merged OCA2-HA (magenta) and inverted bright-field (green) images. All insets show 5× magnified images of the boxed region. Bar, 10 μm. (j) Deconvolved IFM images of each mutant were converted to binary images and analyzed for marker overlap. Each data point represents one cell. Shown is the percentage of punctate/vesicular HA staining that overlapped with pigment in each cell (percentage of OCA2 with pigment). The two point mutants were significantly different from OCA2-AA23 but not from each other. *, p < 0.05; ***, p < 0.001. (k) OCA2-deficient melan-p1 melanocytes were rescued as in Figure 2j. All columns were compared with OCA2-AA23. n.s., not significant. *, p < 0.05; ***, p < 0.001.
FIGURE 8:
FIGURE 8:
Localization of dileucine-motif point mutants in BLOC-1–deficient melanocytes. (a–i) IFM analysis of BLOC-1–deficient cells expressing selected mutant OCA2 variants. Melan-pa1 melanocytes were transfected with OCA2-AA23 (a–c), OCA2-AA23 E96D (d–f), or OCA2-AA23 P99S (g–i). Transgenes were visualized with anti-HA antibodies (a, d, g), and endogenous TYRP1 was visualized in b, e, and h. c, f, and i are merged OCA2-HA (magenta) and TYRP1 (green) images. All insets show 5× magnified images of the boxed region. Bar, 10 μm. (j) Deconvolved IFM images of OCA2-AA23 and OCA2-AA23 E96D were converted to binary images and analyzed for marker overlap. The P99S mutant was not analyzed. Each data point represents one cell. Shown is the percentage of punctate/vesicular HA staining that overlapped with TYRP1 in each cell (percentage of OCA2 with TYRP1). E96D was not significantly different (n.s.) from OCA2-AA23.
FIGURE 9:
FIGURE 9:
Model for role of AP-3, AP-1 and BLOC-1 in transport of OCA2 from endosomes to melanosomes. Shown is a model based on a related model from Delevoye et al. (2009) and the data from this article. In vacuolar endosomes, OCA2 encounters either AP-1 or AP-3, and either is sufficient to target OCA2 to melanosome-bound transport carriers that emerge from these domains. BLOC-1 also functions in an as-yet-unknown capacity during this step. From the transport carriers, binding to AP-3 is required to effect a subsequent transport step that results in stable association with melanosomes.

Similar articles

Cited by

References

    1. Bennett DC, Lamoreux ML. The color loci of mice—a genetic century. Pigment Cell Res. 2003;16:333–344. - PubMed
    1. Boehm M, Bonifacino JS. Adaptins: the final recount. Mol Biol Cell. 2001;12:2907–2920. - PMC - PubMed
    1. Bonifacino JS, Traub LM. Signals for sorting of transmembrane proteins to endosomes and lysosomes. Annu Rev Biochem. 2003;72:395–447. - PubMed
    1. Borner GH, Harbour M, Hester S, Lilley KS, Robinson MS. Comparative proteomics of clathrin-coated vesicles. J Cell Biol. 2006;175:571–578. - PMC - PubMed
    1. Bultema JJ, Ambrosio AL, Burek CL, Di Pietro SM. BLOC-2, AP-3, and AP-1 function in concert with Rab38 and Rab32 to mediate protein trafficking to lysosome-related organelles. J Biol Chem. 2012;287:19550–19563. - PMC - PubMed

Publication types

MeSH terms

LinkOut - more resources