. 2012 Sep;40(16):8085-98.
doi: 10.1093/nar/gks530. Epub 2012 Jun 20.

Analysis of rRNA processing and translation in mammalian cells using a synthetic 18S rRNA expression system

Affiliations

Analysis of rRNA processing and translation in mammalian cells using a synthetic 18S rRNA expression system

Luke G Burman et al. Nucleic Acids Res. 2012 Sep.

Abstract

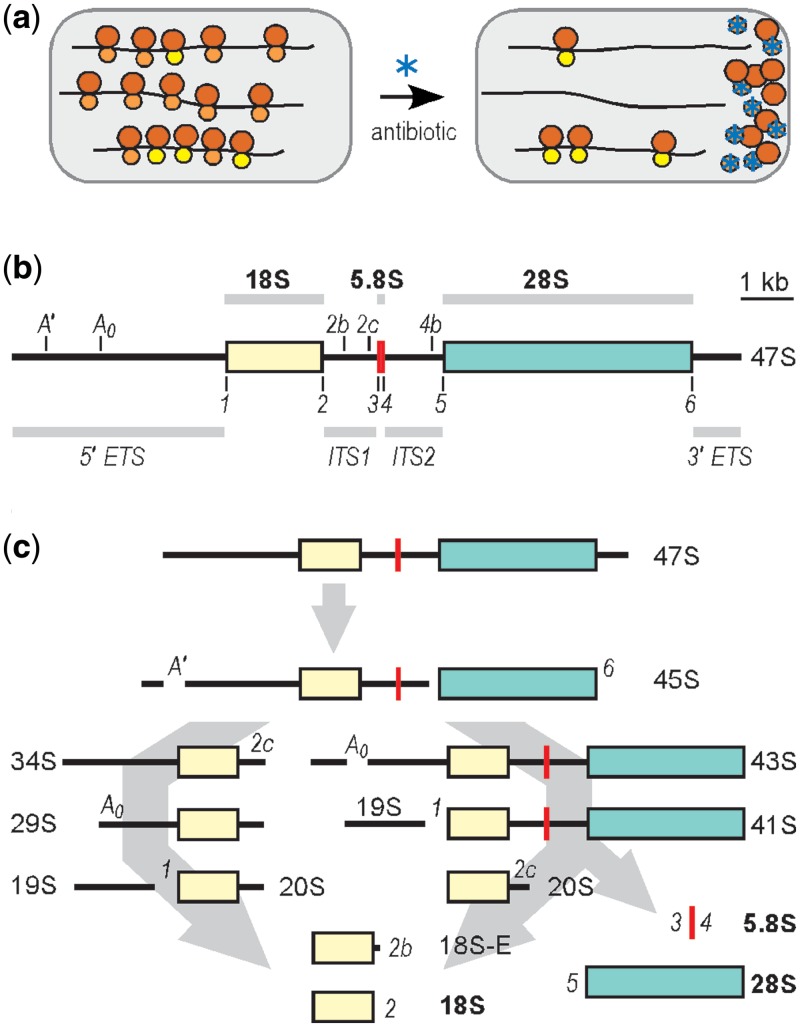
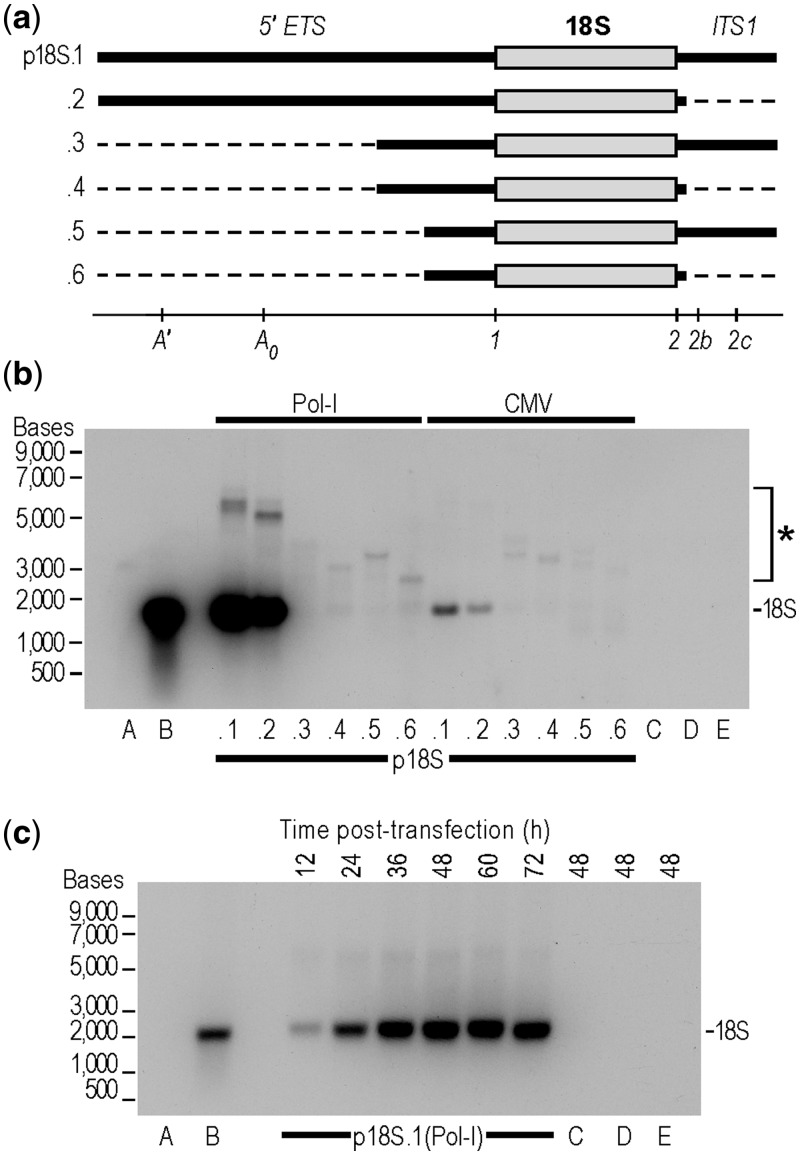
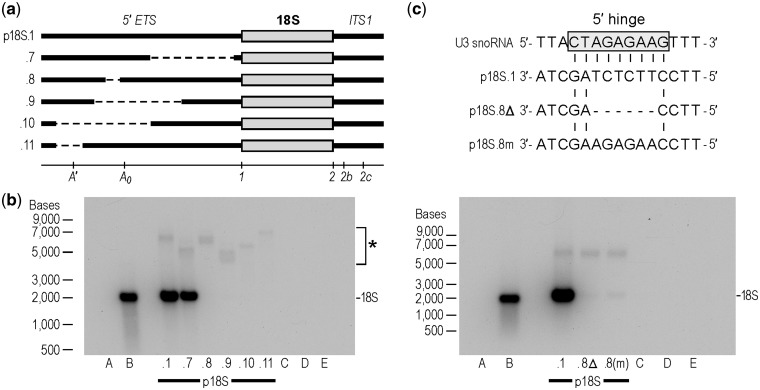
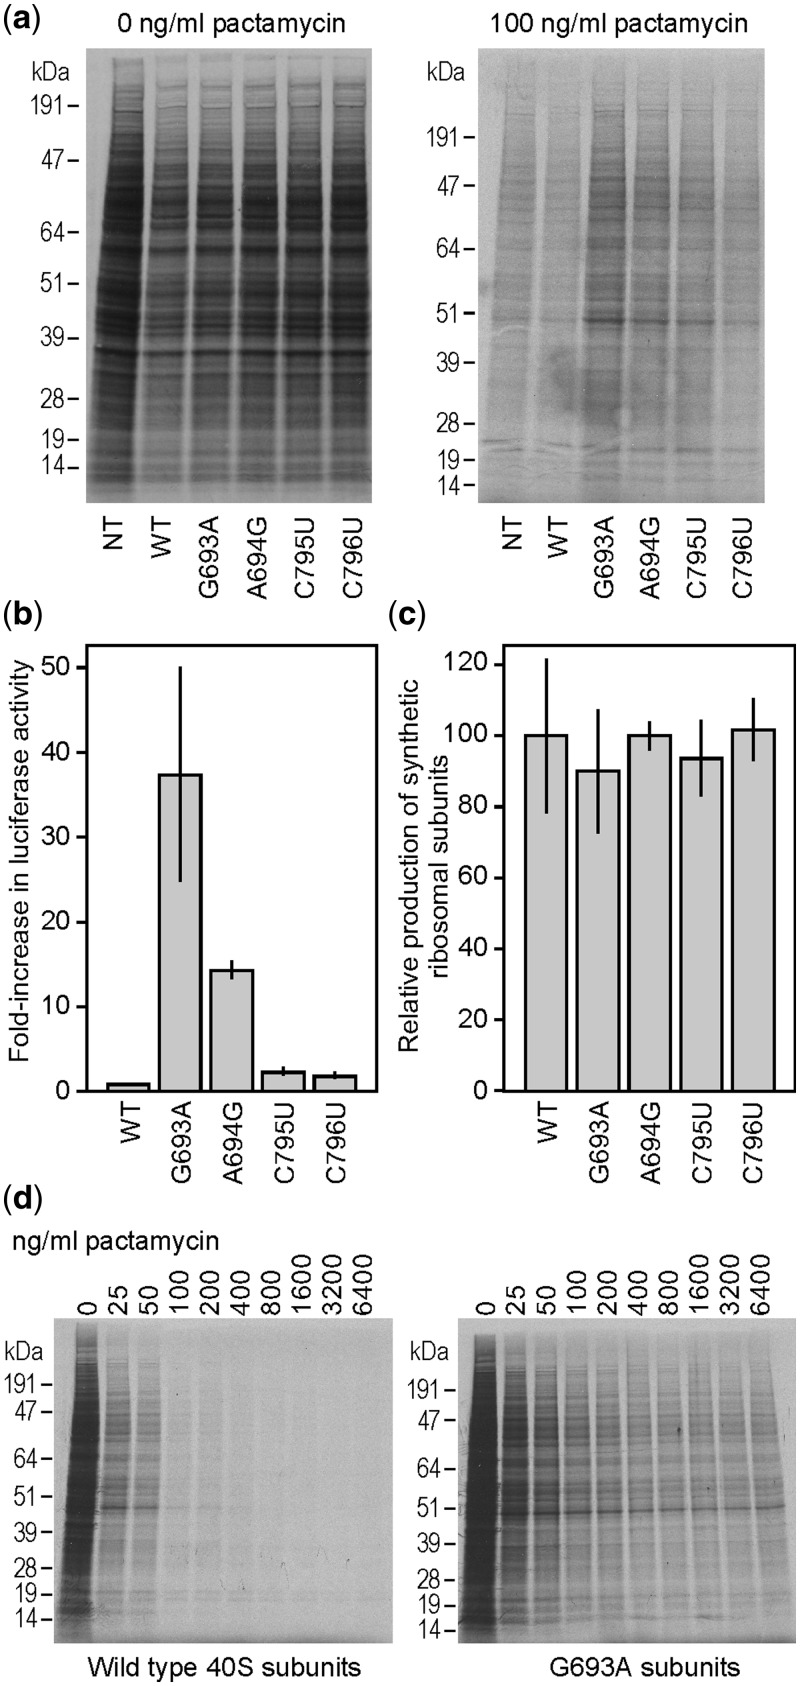
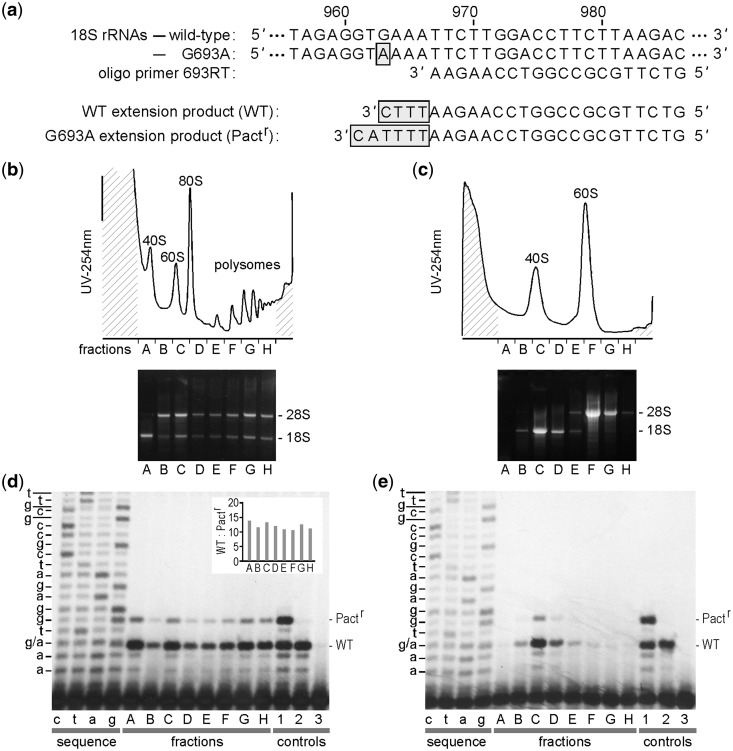
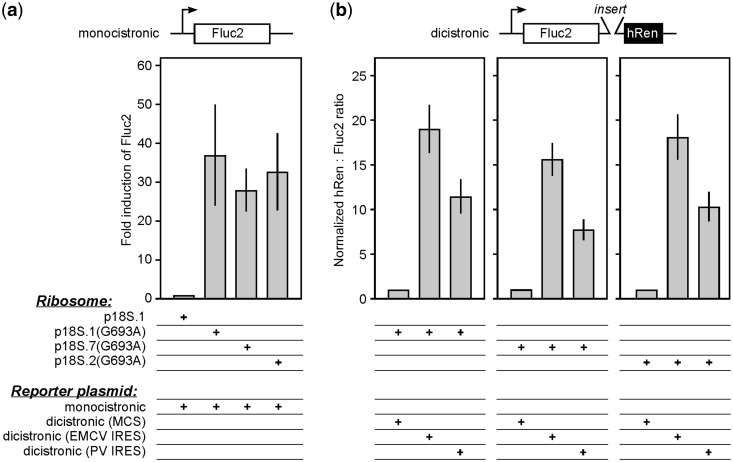
Analysis of processing, assembly, and function of higher eukaryotic ribosomal RNA (rRNA) has been hindered by the lack of an expression system that enables rRNA to be modified and then examined functionally. Given the potential usefulness of such a system, we have developed one for mammalian 18S rRNA. We inserted a sequence tag into expansion segment 3 of mouse 18S rRNA to monitor expression and cleavage by hybridization. Mutations were identified that confer resistance to pactamycin, allowing functional analysis of 40S ribosomal subunits containing synthetic 18S rRNAs by selectively blocking translation from endogenous (pactamycin-sensitive) subunits. rRNA constructs were suitably expressed in transfected cells, shown to process correctly, incorporate into ≈ 15% of 40S subunits, and function normally based on various criteria. After rigorous analysis, the system was used to investigate the importance of sequences that flank 18S rRNA in precursor transcripts. Although deletion analysis supported the requirement of binding sites for the U3 snoRNA, it showed that a large segment of the 5' external transcribed spacer and the entire first internal transcribed spacer, both of which flank 18S rRNA, are not required. The success of this approach opens the possibility of functional analyses of ribosomes, with applications in basic research and synthetic biology.


Figures

Figure 1.
Figure 1.
(a) Schematic representation of an rRNA expression platform. Grey enclosures represent cells and contain polysomes with mRNA indicated as black lines and ribosomal subunits as circles (60S subunits as larger circles; 40S subunits as smaller circles). The sandy brown 40S subunits are antibiotic-sensitive endogenous subunits; the yellow 40S subunits contain synthetic 18 S rRNA and are antibiotic resistant. The different colors are used to indicate that the subunits are physically distinguishable. A cell-permeable antibiotic (blue asterisk) binds to and blocks the activity of endogenous 40S subunits. Synthetic 40S subunits are unaffected and are able to translate under these conditions. (b) Mouse 47S primary rRNA transcript, 47S rRNA is indicated schematically as a horizontal line. The colored sections represent encoded rRNAs: 18 S in light yellow; 5.8S in red; and 28S in turquoise. The 18 S rRNA is the RNA component of 40S ribosomal subunits and the 28S and 5.8S rRNAs are RNA components of 60S subunits. The black lines represent the external transcribed spacer regions (5′ ETS and 3′ ETS) and the internal transcribed spacer regions (ITS1 and ITS2), as indicated. Cleavage sites in the transcribed spacers are indicated as vertical lines and labeled. (c) Processing pathways. Processing of the precursor transcripts involves numerous protein and RNA factors and has been studied extensively in various organisms (44). The mouse 47S precursor rRNA is transcribed in the nucleolus by RNA polymerase I, and is subsequently processed by two possible pathways. Cleavage proceeds in the direction of the arrows from 47S to 18 S, 5.8S, and 28S rRNAs; 45S rRNA can be processed to 18 S rRNA by two pathways as indicated, which generate different intermediate products. Processing sites and major cleavage products resulting from maturation of 18 S rRNA are indicated at each cleavage step. Processing of 5.8S and 28S rRNAs involve additional cleavage steps and intermediate products, which are not indicated. This figure is adapted from ref. (13).
Figure 2.
Figure 2.
Analysis of processing of rRNA constructs. (a) Schematic representation of RNAs expressed from constructs p18 S.1-.6. Constructs contain either a pol-I promoter and 3′ ETS, or a CMV promoter and an SV40 poly(A) signal. The 5′ ETS and ITS1 are indicated by thick black lines, the 18 S rRNA by a grey bar and deleted spacer sequences by thin dashed lines. Cleavage sites are indicated. (b) Northern blot analysis of 18 S rRNA processing. N2a cells were transfected with the constructs indicated and RNA analyzed by Northern blots as described in Methods. Nucleotide positions of a single-stranded RNA size ladder are indicated to the left side of the blot. This blot contains the following controls: A: 100-ng 18 S WT transcript, B: 100-ng 18 S-tagged transcript, C: 2-µg total RNA from N2a cells transfected with p18 S.1 untagged (Pol-1), D: 2-µg total RNA from mock transfected N2a cells, E: 2-µg total RNA from N2a cells. Synthetic rRNA was detected by hybridization to an inserted tag sequence using the α-tag probe. The upper bands (asterisk) correspond to full-length and partially processed transcripts. The location of mature 18 S rRNA is indicated. (c) Time course of 18 S rRNA accumulation from construct p18 S.1 (Pol-1). For these experiments, N2a cells were transfected, and RNA was harvested at various times post-transfection as indicated. The controls are the same as in (b).
Figure 3.
Figure 3.
Analysis of contribution of 5′ ETS sequences to 18 S rRNA processing. (a) Schematic representation of constructs as in Figure 2. Constructs contain a pol-I promoter and 3′ ETS. (b) Northern blot analysis of 18 S rRNA processing. N2a cells were transfected with the constructs indicated and RNA analyzed by Northern blots as described in Methods. Synthetic rRNA was detected by hybridization to an inserted tag sequence using the α-tag probe. The asterisk indicates full-length and partially processed transcripts. The location of mature 18 S rRNA is indicated. Controls for this blot are as described in Figure 2. (c) Top: Schematic shows comparison of U3 snoRNA 5′ hinge region to p18 S.1, p18 S.8Δ, and p18 S.8m; the complementary sequence match to p18 S.1 is highlighted. Bottom: The Northern blot shows synthetic rRNA expression from N2a cells transfected with the indicated constructs. This blot was hybridized with the α-tag probe, as in panel (b). Controls for this blot are as described in Figure 2.
Figure 4.
Figure 4.
Analysis of pactamycin-resistance mutations in N2a cells. (a) Protein expression in cells expressing WT or mutated 18 S rRNA constructs. Cells were either not transfected (NT) or transfected with constructs expressing WT 18 S rRNA or 18 S rRNAs containing the point mutations indicated. Cells were then 35S pulse-labeled in the absence or presence of 100 ng/ml pactamycin as indicated, cells were lysed, and equal volumes of the cell lysates were analyzed by SDS-PAGE, as described in Methods. Representative autoradiograms are shown. (b) Relative luciferase activities in cell lysates from cells transfected with WT or mutated 18 S rRNAs and with pGL4.13 (Promega). N2a cells were cotransfected with the 18 S rRNA constructs indicated and with a firefly luciferase construct (pGL4.13) and luciferase expression monitored from cell lysates. Luciferase activities are relative to those obtained from cells transfected with the WT construct, which is set to 1.0. Details of the cotransfection and assay methods are described in Methods. (c) Quantification of synthetic rRNA levels from Northern blots for cells transfected with WT or mutated rRNA constructs. Synthetic rRNA was detected by hybridization with the α-tag probe. Signals were quantified using a Molecular Dynamics Phosphorimager system and are represented relative to WT, with WT set to 100%. (d) Cells were transfected with either WT or G693A mutation-containing 18 S rRNA constructs and incubated with various amounts of pactamycin as indicated. Cells were 35S pulse-labeled, and cell lysates analyzed by SDS-PAGE. Representative autoradiograms are shown. In panels (b) and (c) error bars represent standard deviations from 3 independent experiments.
Figure 5.
Figure 5.
Sucrose density gradient distributions of ribosomal subunits containing synthetic 18 S rRNAs. (a) ddCTP primer extension assay. Partial sequences of WT and mutated 18 S rRNAs are shown. The position of the pactamycin-resistance mutation (G693A), located at nucleotide 963 in 18 S rRNA, is highlighted. The sequence of oligonucleotide primer 693RT is shown aligned to its complementary match in the 18 S rRNAs. Primer extension reactions performed in the presence of ddCTP will terminate at the first G located upstream of the primer. This will result in 4-nt-extended products from WT 18 S rRNA templates and 6-nt-extended products from G693A-mutated 18 S rRNAs. In each case, the extended nucleotides are highlighted. (b) Top: Lysates from cycloheximide-treated N2a cells transfected with p18 S.1(G693A) were fractionated in a 10–50% (w/v) linear sucrose gradient. Peaks (left to right) represent 40S ribosomal subunits, 60S ribosomal subunits, 80S single ribosomes, and polysomes. The fractions (A-H) that were collected for RNA analysis are indicated. Bottom: RNA prepared from fractions A-H was visualized in an ethidium bromide-stained agarose gel. The 28S and 18 S rRNAs are indicated. (c) Top: EDTA-dissociated ribosomes were fractionated on a 10–35% (w/v) linear sucrose gradient. Peaks (left to right) represent 40S and 60S ribosomal subunits. Bottom: RNA analysis as in panel (b). (d) PAGE analysis of RNA prepared from fractions of the sucrose gradient in panel (b), which were subjected to ddCTP primer extension using oligonucleotide primer 693RT, which was 33-P-labeled. The sequencing reactions (lanes c,t,a,g) used the same primer with total RNA as a template. The upper bands are generated from the synthetic 18 S rRNA (Pactr) and the lower bands are from endogenous 18 S rRNA (WT). Lanes 1-3 are controls. Control 1 is an equimolar mixture of in vitro transcripts that contain or lack the pactamycin resistance mutation. Control 2 is total RNA from untransfected N2a cells, which contains only the WT 18 S rRNA. Control 3 is a no template control. The levels of the primer extension products from the various fractions were quantified from Phosphorimager exposures and the ratios of the two bands (WT:Pactr) are shown in the inset. (e) ddCTP primer extension from fractions of gradient in panel (c).
Figure 6.
Figure 6.
Analysis of function of synthetic 18 S rRNAs containing deletions in 5′ ETS or ITS1. (a) Reporter assays of N2a cells cotransfected with a monocistronic reporter construct expressing an optimized firefly luciferase (Fluc2) and various 18 S rRNA constructs as indicated. A schematic representation of the monocistronic construct is shown above. The synthetic rRNAs used in each experiment are indicated below the graph: p18 S.1 contains the full 5′ ETS and ITS1, p18 S.7 contains a deletion of the 3′ region of the 5′ ETS, and p18 S.2 lacks ITS1. Luciferase activities were determined as described in Methods. The results of the various transfections are reported as fold induction of Fluc2, which is luciferase activity over background obtained with WT (pactamycin-sensitive) ribosomes (p18 S.1). (b) Reporter assays of N2a cells transfected with dicistronic reporter constructs expressing Fluc2 and an optimized human Renilla luciferase (hRen). The control construct contained an MCS in the intercistronic region; the other constructs contained either the EMCV or PV IRES. The 18 S rRNA constructs and reporter constructs used in each experiment are indicated below the graph. The results are reported as hRen to Fluc2 ratios normalized to the MCS construct, which has no IRES activity. Error bars represent standard deviations from 3 independent experiments.

Similar articles

Cited by

References

    1. Stelzl U, Connell S, Wittman-Liebold B. Encyclopedia of Life Sciences. John Wiley & Sons, Ltd; 2001. Ribosomal proteins: role in ribosomal functions; pp. 1–12.
    1. Wool IG. Extraribosomal functions of ribosomal proteins. Trends. Biochem. Sci. 1996;21:164–165. - PubMed
    1. Mauro VP, Edelman GM. The ribosome filter hypothesis. Proc. Natl Acad. Sci. USA. 2002;99:12031–12036. - PMC - PubMed
    1. Mauro VP, Edelman GM. The ribosome filter redux. Cell Cycle. 2007;6:2246–2251. - PMC - PubMed
    1. Luttermann C, Meyers G. The importance of inter-and intramolecular base pairing for translation reinitiation on a eukaryotic bicistronic mRNA. Genes. Dev. 2009;23:331–344. - PMC - PubMed

Publication types

Associated data