. 2012 Sep;40(16):7739-52.
doi: 10.1093/nar/gks545. Epub 2012 Jun 19.

Regulation of p21/CIP1/WAF-1 mediated cell-cycle arrest by RNase L and tristetraprolin, and involvement of AU-rich elements

Affiliations

Regulation of p21/CIP1/WAF-1 mediated cell-cycle arrest by RNase L and tristetraprolin, and involvement of AU-rich elements

Latifa Al-Haj et al. Nucleic Acids Res. 2012 Sep.

Abstract

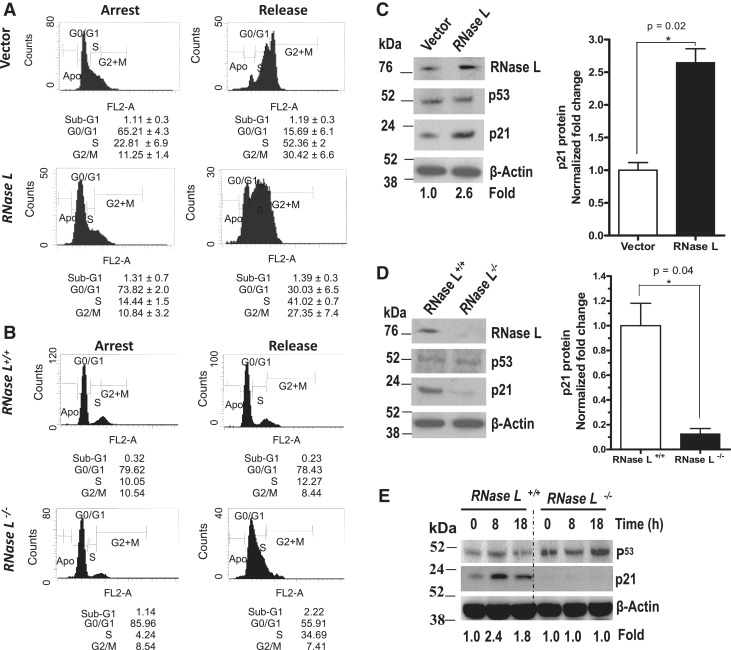
The p21(Cip1/WAF1) plays an important role in cell-cycle arrest. Here, we find that RNase L regulates p21-mediated G(1) growth arrest in AU-rich elements-dependent manner. We found a significant loss of p21 mRNA expression in RNASEL(-/-) MEFs and that the overexpression of RNase L in HeLa cells induces p21 mRNA expression. The p21 mRNA half-life significantly changes as a result of RNase L modulation, indicating a post-transcriptional effect. Indeed, we found that RNase L promotes tristetraprolin (TTP/ZFP36) mRNA decay. This activity was not seen with dimerization- and nuclease-deficient RNase L mutants. Deficiency in TTP led to increases in p21 mRNA and protein. With induced ablation of RNase L, TTP mRNA and protein expressions were higher, while p21 expression became reduced. We further establish that TTP, but not C124R TTP mutant, binds to, and accelerates the decay of p21 mRNA. The p21 mRNA half-life was prolonged in TTP(-/-) MEFs. The TTP regulation of p21 mRNA decay required functional AU-rich elements. Thus, we demonstrate a novel mechanism of regulating G(1) growth arrest by an RNase L-TTP-p21 axis.


Figures

Figure 1.
Figure 1.
RNase L-mediated cell-cycle arrest and p21 induction. (A) Flow cytometric analysis of RNase L polyclonal and control cells. Cells were synchronized at the G1 phase by confluency and aphidicholin treatment for 18 h. Cells were released by 15% FBS for 6 h and were then subjected for flow cytometry. (B) Flow cytometric analysis for cell-cycle profiles of RNase L+/+ and RNase L−/− mouse embryonic fibroblasts. (C) Expression of p21 and p53 proteins in RNase L-expressing HeLa cells and vector-expressing cells. Cell lysates were subjected to western blotting using specific antibodies. The p21 band intensities were quantified using (ImageJ 1.44 software), and β-actin normalized fold differences were calculated (right panel). The results are represented as the mean ± SEM of two independent experiments. (D) RNase L+/+ and RNase L−/− MEF cells lysates were subjected to western blotting for p53 and p21 levels, using specific antibodies for p53 and p21. The results of β-actin normalized band intensities are represented as the mean ± SEM of two independent experiments. (E) Wild-type and RNase L-deficient cells were treated with 10 Gy of γ-radiation and incubated for the indicated times. Total cell lysates were analyzed for western blotting, using specific antibodies for p21 and p53.
Figure 2.
Figure 2.
RNase L modulates p21 mRNA expression. (A) The p21 mRNA expression in RNase L+/+ and RNase L−/− MEFs. Total RNA was extracted and subjected to RT–qPCR by using specific TaqMan probes for p21. Results are represented as the Mean ± SEM of three independent experiments, each with duplicate readings. (B) RNase L+/+ and RNase L−/− MEFs were treated with 10 Gy of γ-radiation and incubated for the indicated times. Total RNAs were extracted and subjected to RT-QPCR for p21 mRNA expression. Data are represented as the mean ± SEM of two independent experiments. P-values were calculated using a Student’s t-test. (C) RNase L prolongs the half-life of p21 mRNA. Actinomycin D (AcD) (5 µg/ml) was added to the culture medium of RNase L+/+ and RNase L−/− cells for the indicated times, followed by total RNA extraction and cDNA synthesis. p21 mRNA half-life was calculated using one-phase exponential decay curve analysis (20) (GraphPad Prism) to assess mRNA decay kinetics. Data are from one representative experiment of at least two independent experiments. Right panel inset shows the basal levels of p21 mRNA—i.e. before actinomycin D addition, as log10 values. (D) The p21 mRNA half-life determination in stable RNase L-overexpressing polyclonal RNase L cells. Data are represented as the mean ± SEM of two independent experiments, using the same protocol as in the C legend. (E) Schematic diagram showing the domain structure of wild-type RNase L and mutant variants (R462Q, Δ-Cterm, or Δ-exon3). (F) The p21 mRNA expression as influenced by wild-type and mutant variants. HEK293 cells overexpressing RNase L, R462Q, Δ-C terminal mutant, or Δ-exon3 variant were used to quantify relative p21 mRNA expression. The results are represented as the mean ± SEM of two independent experiments. P-value are *P < 0.01 and **P < 0.001 (Student’s t-test).
Figure 3.
Figure 3.
RNase L-mediated stabilization of p21 mRNA is associated with the repression of an RNA decay-promoting protein. (A) Real-time PCR determination of endogenous HuR and p21 transcripts physically associated with RNase L. Lysate from HEK293 cells transfected with HA tagged RNase L or control vector were used in immunoprecipitation. Immunoprecipitation was carried out using anti-HA or IgG antibody. The results are represented as the mean ± SEM of two independent experiments. ***P < 0.0001 (Student’s t-test). (B) Real-time PCR monitoring of endogenous TTP, ZFP36L1 and TIA1 transcripts associated with the overexpression of wild-type RNase L or mutant variant R462Q. The results are represented as the mean ± SEM of two independent experiments, ***P < 0.001 (Student’s t test). (C) Immunoblotting for HA tagged wild-type and mutants RNase L using anti-HA antibody, and TTP (using anti-TTP antibody) in Huh-7 cells overexpressing wild-type RNase L, R462Q mutant, or Δ-exon3 form (a truncated protein of ∼54 kDa due to exon 3 deletion-induced premature termination-See Figure 2E). All of these constructs are tagged by HA for detecting the expressed proteins from the transfected constructs. β-Actin was used as a loading control. (D) Real-time PCR monitoring of endogenous TTP transcript. Fold change was normalized to the mouse β-Actin housekeeping gene. The results are represented as the mean ± SEM of two independent experiments. **P < 0.001 (Student’s t-test). (E) Immunoblotting of TTP in RNase L+/+ and RNase L−/− mouse embryonic fibroblasts. Band intensities were quantified using ImageJ 1.44 software, and fold differences were calculated. (F) QPCR for endogenous TTP transcript associated with RNase L silencing. Fold increase was normalized to human large ribosomal protein (RPL0) housekeeping gene. The results are represented in terms of the mean ± SEM of two independent experiments. *P = 0.02 (Student’s t-test). (G) The immunoblotting of endogenous TTP associated with silencing of RNase L. Huh-7 cells were transfected with shRNA for RNase L or control shRNA, and western blotting was performed for RNase L, TTP, or β-actin.
Figure 4.
Figure 4.
RNase L regulates TTP mRNA stability. (A) Real-time QPCR of endogenous TTP mRNA physically associated with RNase L or mutant variants (R462Q or Δ exon3) and precipitated with anti-HA antibody (IP-RNA protocols are detailed in ‘Materials and Methods’ section). The results are represented as the mean ± SEM of two independent experiments. **P < 0.001 (Student’s t-test). (B) TTP mRNA half-life determination in RNase L+/+ and RNase L−/− mouse embryonic fibroblasts. (C) TTP mRNA half-life determination in RNase L-overexpressing HeLa cell line. (D) Real-time QPCR of TTP mRNA extracted from RNA material physically associated with wild-type TTP or C124R and obtained by precipitation with either anti-TTP antibody or control IgG (IP-RNA protocols are detailed in ‘Materials and Methods’ section). (E) Half-life determination of mRNA generated from the transfected C124R plasmid bearing TTP 3′ UTR in Huh7 cells overexpressing pcDNA3.1 vector or RNase L. (F) Half-life determination of mRNA generated from transfected TTP plasmid bearing control stable BGH 3′ UTR in Huh7 cells overexpressing pcDNA3.1 vector or RNase L. In all mRNA half-life determination above, actinomycin D (AcD; 5 µg/ml) was added to the culture medium for the indicated times, followed by total RNA extraction and cDNAs synthesis. To amplify only transfected but not endogenous TTP, specifically positioned primers were used (arrows indicate PCR primers). The TTP mRNA half-life was calculated using one-phase exponential decay curve analysis (GraphPad Prism).
Figure 5.
Figure 5.
TTP regulates p21 mRNA stability. (A) TTP+/+ and TTP−/− MEFs were used to measure the expression of endogenous p21 transcript using QPCR. The expression was normalized to the mouse Gapdh housekeeping gene. The results are represented as the mean ± SEM of two independent experiments. ***P = 0.0006 (Student’s t-test). (B) Immunoblotting for p53 and p21, using TTP+/+ and TTP−/− MEFs total cell lysate. (C) TTP regulation of the p21 mRNA half-life in TTP+/+ and TTP−/− MEFs cells. (D) Real-time PCR of endogenous p21 mRNA physically associated with wild-type or mutant TTP (C124R) and precipitated with anti-TTP antibody (IP-RNA details are given in ‘Materials and Methods’ section). The results are represented as the mean ± SEM of two independent experiments. *P = 0.02 (Student’s t test).
Figure 6.
Figure 6.
TTP regulation of p21 mRNA is AU-rich element-dependent. (A) Schematic diagram of control, p21 and p21 mutant ARE-containing EGFP reporter constructs under the control of the cellular promoter of ribosomal protein, RPS30 (20). (B) TTP regulation of p21 ARE-containing EGFP reporter activity. HEK293 cells were cotransfected with the indicated reporters along with control vector plasmid [PCR3.1, TTP, or C124R (mutant TTP)]. GFP fluorescence was measured 24 h post-transfection. The results are represented as the mean ± SEM of two independent experiments. ***P < 0.001 (Student's t test). (C) Upper panel, schematic diagram of p21 mRNA. The sequence of the p21 RNA probe used in RNA/EMSA is shown; ARE regions are underlined. Middle panel, electromobility gel shift assay (RNA-EMSA). The p21 ARE probe (lane 1) was incubated with 5 µg of TTP-overexpressing HEK293 (lanes 2) or C124R-overexpressing HEK293 cells (lane3) protein lysate. Arrows indicate the TTP-bound biotinylated RNA complex. A supershift assay was carried out in the same manner, except that protein lysate from TTP or C124R-overexpressing HEK293 protein lysates (lanes 4 and 5, respectively) were pre-incubated with anti-TTP antibody for 30 min before the addition of the biotinylated probe. The upper bands indicates the locations of supershifted band. A competition assay was carried out in the presence (+) of 1000-fold excess of unlabeled RNA competitor (lane 6). (Inset) A representative western blot for HEK293 cells overexpressing either wild-type TTP or mutant TTP (C124R) using anti-TTP or anti-β-actin antibodies.
Figure 7.
Figure 7.
RNase L-mediated stabilization of p21 is enhanced by silencing TTP. (A) Huh-7 cells were transfected with TTP siRNA or control scrambled siRNA for 48 h. Two amounts of the lysates were used in western blotting for TTP using anti-TTP antibody (left panel) to assess knockdown efficiency (right panel). (B) Upper panel, real-time QPCR for p21 mRNA expression in TTP silenced cells. Huh-7 cells were transfected with TTP siRNA or control scrambled siRNA; 48 h later, the cells were transfected with vector control or RNase L plasmid. The results are represented as the mean ± SEM of two independent experiments. **P = 0.004, (Student’s t-test), * denotes P < 0.01, as assessed by ANOVA. Lower panel: western blotting for the transfected HA-RNase L. (C) The schematic diagram shows the proposed p21-mediated regulation of cell-cycle arrest by the RNase L-TTP axis. RNase L binds and degrades TTP mRNA resulting in lower level of TTP. TTP binds and degrades p21 mRNA in ARE-dependent manner, thus, the lower levels of TTP, lead to increased mRNA stability and subsequently increased p21 protein. The increased levels of p21 potentiate the G1–S arrest of the cell cycle.

References

    1. Zhou A, Paranjape J, Brown TL, Nie H, Naik S, Dong B, Chang A, Trapp B, Fairchild R, Colmenares C, et al. Interferon action and apoptosis are defective in mice devoid of 2′,5′-oligoadenylate-dependent RNase L. EMBO J. 1997;16:6355–6363. - PMC - PubMed
    1. Khabar KS, Dhalla M, Siddiqui Y, Zhou A, Al-Ahdal MN, Der SD, Silverman RH, Williams BR. Effect of deficiency of the double-stranded RNA-dependent protein kinase, PKR, on antiviral resistance in the presence or absence of ribonuclease L: HSV-1 replication is particularly sensitive to deficiency of the major IFN-mediated enzymes. J. Interferon Cytokine Res. 2000;20:653–659. - PubMed
    1. Bisbal C, Silverman RH. Diverse functions of RNase L and implications in pathology. Biochimie. 2007;89:789–798. - PMC - PubMed
    1. Castelli JC, Hassel BA, Wood KA, Li XL, Amemiya K, Dalakas MC, Torrence PF, Youle RJ. A study of the interferon antiviral mechanism: apoptosis activation by the 2-5A system. J. Exp. Med. 1997;186:967–972. - PMC - PubMed
    1. Al-Ahmadi W, Al-Haj L, Al-Mohanna FA, Silverman RH, Khabar KS. RNase L downmodulation of the RNA-binding protein, HuR, and cellular growth. Oncogene. 2009;28:1782–1791. - PMC - PubMed

Publication types