. 2012 Sep;40(16):7907-15.
doi: 10.1093/nar/gks626. Epub 2012 Jun 19.

Topoisomerase II is required for the production of long Pol II gene transcripts in yeast

Affiliations

Topoisomerase II is required for the production of long Pol II gene transcripts in yeast

Ricky S Joshi et al. Nucleic Acids Res. 2012 Sep.

Abstract

The extent to which the DNA relaxation activities of eukaryotic topoisomerases (topo I and topo II) are redundant during gene transcription is unclear. Although both enzymes can often substitute for each other in vivo, studies in vitro had revealed that the DNA cross-inversion mechanism of topo II relaxes chromatin more efficiently than the DNA strand-rotation mechanism of topo I. Here, we show that the inactivation of topo II in budding yeast produces an abrupt decrease of virtually all polyA+ RNA transcripts of length above ≈ 3 kb, irrespective of their function. This reduction is not related to transcription initiation but to the stall of RNA polymerase II (Pol II) during elongation. This reduction does not occur in topo I mutants; and it is not avoided by overproducing yeast topo I or bacterial topo I, which relaxes (-) DNA supercoils. It is rescued by catalytically active topo II or a GyrBA enzyme, which relaxes (+) DNA supercoils. These findings demonstrate that DNA relaxation activities of topo I and topo II are not interchangeable in vivo. Apparently, only topo II relaxes efficiently the (+) DNA supercoils that stall the advancement of Pol II in long genes. A mechanistic model is proposed.


Figures
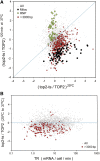
Figure 1.
Figure 1.
Yeast transcriptome response to the inactivation of topo II. (A) Comparison of genome-wide transcript abundance before and after shifting the control TOP2 strain and the top2-ts yeast mutant to the non-permissive temperature. The microarray data is plotted as the ratio [top2-ts/TOP2] at 25°C (x-axis) against [top2-ts/TOP2] 120 min at 37°C (y-axis). Each grey spot corresponds to an ORF. Mitochondrial- and ribonucleoprotein complex-related genes that significantly changed after topo II inactivation are represented by black and green dots, respectively. Red diamonds correspond to yeast transcripts >3 kb. (B) The microarray data (y-axis), represented as ([top2-ts/TOP2] at 37°C/[top2-ts)/TOP2] at 25°C), is plotted against the expression level of yeast genes reported by García-Martinez et al. (23). Expression level of each gene (TR, transcription rate) is represented as molecules of mRNA produced/cell/min (x-axis, logarithmic scale). Each grey spot corresponds to a gene. Red diamonds correspond to genes >3 kb.
Figure 2.
Figure 2.
Dependence of transcript abundance and length on inactivation of topo II. (A) Microarray data ([top2-ts/TOP2] at 37°C/[top2-ts)/TOP2] at 25°C) are represented as sliding means (log2) of 50 consecutive genes arranged by their size in bp (black line, left scale). P-values (log) associated to Student’s t-test of each point value compared to the whole genome values are illustrated (grey line, right scale). (B) Comparison between microarray data (grey dots) and qRT-PCR data (black dots) for 16 genes of different sizes (from 179 to 8018 bp). Results are given as ([top2-ts/TOP2] at 37°C/[top2-ts)/TOP2] at 25°C) ratios plotted against gene size (logarithmic scale). (C–E) Relative abundance of yeast transcripts grouped by size categories in yeast cells deprived of topo I (Δtop1 TOP2), both topo I and topo II (Δtop top2-ts), and only topo II (TOP1 top2-ts) in comparison to the TOP1 TOP2 cells (wt).
Figure 3.
Figure 3.
Effects of topo II inactivation on transcription initiation according to gene size. Microarray data from genomic run-on experiments ([top2-ts/TOP2] at 37°C/[top2-ts)/TOP2] at 25°C) are represented as sliding means (log2) of 50 consecutive genes arranged by their size in bp (black line). For comparison, the alterations of transcript abundance observed in the same experimental conditions (as described in the analogous plot of Figure 2A) are shown (grey line).
Figure 4.
Figure 4.
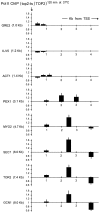
Changes in the intragenic distribution of RNA polymerase II after topo II inactivation. Pol II ChIP DNA fragments (average length ∼350 bp) located at increasing distances from the transcription start site (TSS) were quantified by qRT-PCR in eight yeast genes (1.0 kb GRE2; 1.2 kb ILV5; 1.4 kb ACT1; 3.1 kb PEX1; 4.7 kb MYO2; 6.0 kb SEC7; 7.4 kb TOR2; 8.0 kb GCN1). The positions of the intragenic fragments analyzed are illustrated for each individual gene. Histograms show the ratio of RNA pol II density (left scale) of the top2-ts relative to the control TOP2 yeast strain following a 120-min shift to 37°C. The average of three experiments is shown. Error bars represent the SD.
Figure 5.
Figure 5.
Effect of the ectopic expression of topoisomerases on the abundance of long transcripts. TOP2 and top2-ts yeast strains were transformed with plasmids that carried distinct DNA topoisomerase genes under the galactose inducible Gal1 promoter: (A) Yep24 (control), (B) YEpTOP2-GAL1 (S. cerevisiae topo II), (C) YEpTOP2 (Y782F)-GAL1 (catalytically inactive S. cerevisiae topo II), (D) pRK-G1T1 (S. cerevisiae topo I), (E) YEptopA-GAL1 (E.coli topo I) and (F) pSTS77 (a GyrB-GyrA fusion protein). Induction of the ectopic genes was done during 12 h before shifting the yeast cultures to 37°C to inactivate cellular topo II. The variations of transcript abundance of four genes (4 kb MYO2; 6.0 kb SEC7; 7.4 kb TOR2; 8.0 kb GCN1) were examined by qRT-PCR. Results are given as ([top2-ts/TOP2] at 37°C/[top2-ts)/TOP2] at 25°C) ratios. The average of three experiments is shown. Error bars represent the SD. As explained in the main text, the distinct DNA relaxation mechanisms of the expressed topoisomerases are illustrated.
Figure 6.
Figure 6.
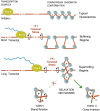
Model to explain the specific role of topo II during transcription elongation in long genes. At transcription initiation, the typical nucleosome organization of downstream chromatin stabilizes (−) DNA supercoils. During transcriptional elongation, (+) torsion builds up in the DNA in front of the RNA polymerase. Because its generation rate exceeds its relaxation rate by cellular topoisomerases, (+) torsional stress increases in a transcript-length dependent manner. This torsional stress diffuses to downstream regions, where it is buffered by alterations in the topology of nucleosomal DNA. When this buffering capacity is surpassed, downstream chromatin enters the supercoiling regime. In this chromatin conformation, the DNA strand-rotation mechanism of topo I is not efficient and only the DNA cross-inversion mechanism of topo II is able to remove the (+) DNA supercoils, which would otherwise stall the progression of the RNA polymerase.

References

    1. Roca J. The torsional state of DNA within the chromosome. Chromosoma. 2011;120:323–334. - PubMed
    1. Liu LF, Wang JC. Supercoiling of the DNA template during transcription. Proc. Natl Acad. Sci. USA. 1987;84:7024–7027. - PMC - PubMed
    1. Champoux JJ. DNA topoisomerases: structure, function, and mechanism. Annu. Rev. Biochem. 2001;70:369–413. - PubMed
    1. Wang JC. Cellular roles of DNA topoisomerases: a molecular perspective. Nat. Rev. Mol. Cell Biol. 2002;3:430–440. - PubMed
    1. Schoeffler AJ, Berger JM. DNA topoisomerases: harnessing and constraining energy to govern chromosome topology. Q. Rev. Biophys. 2008;41:41–101. - PubMed

Publication types

MeSH terms