

Social encounter networks: collective properties and disease transmission
- PMID: 22718990
- PMCID: PMC3479920
- DOI: 10.1098/rsif.2012.0357
Social encounter networks: collective properties and disease transmission
Abstract
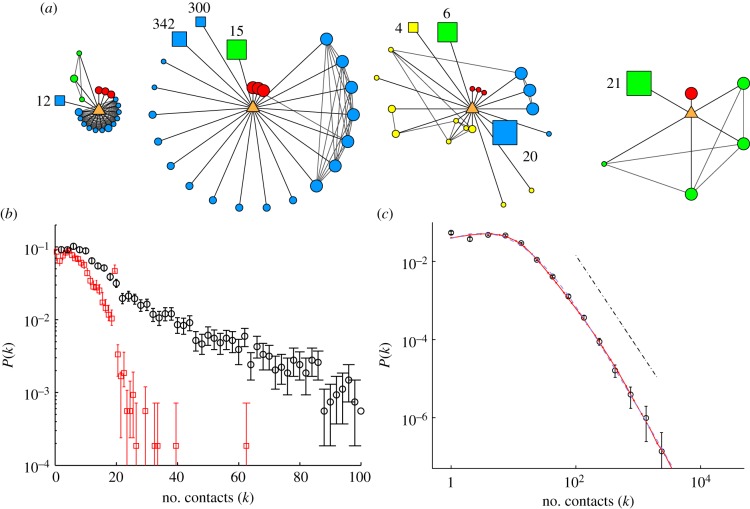
A fundamental challenge of modern infectious disease epidemiology is to quantify the networks of social and physical contacts through which transmission can occur. Understanding the collective properties of these interactions is critical for both accurate prediction of the spread of infection and determining optimal control measures. However, even the basic properties of such networks are poorly quantified, forcing predictions to be made based on strong assumptions concerning network structure. Here, we report on the results of a large-scale survey of social encounters mainly conducted in Great Britain. First, we characterize the distribution of contacts, which possesses a lognormal body and a power-law tail with an exponent of -2.45; we provide a plausible mechanistic model that captures this form. Analysis of the high level of local clustering of contacts reveals additional structure within the network, implying that social contacts are degree assortative. Finally, we describe the epidemiological implications of this local network structure: these contradict the usual predictions from networks with heavy-tailed degree distributions and contain public-health messages about control. Our findings help us to determine the types of realistic network structure that should be assumed in future population level studies of infection transmission, leading to better interpretations of epidemiological data and more appropriate policy decisions.
Figures
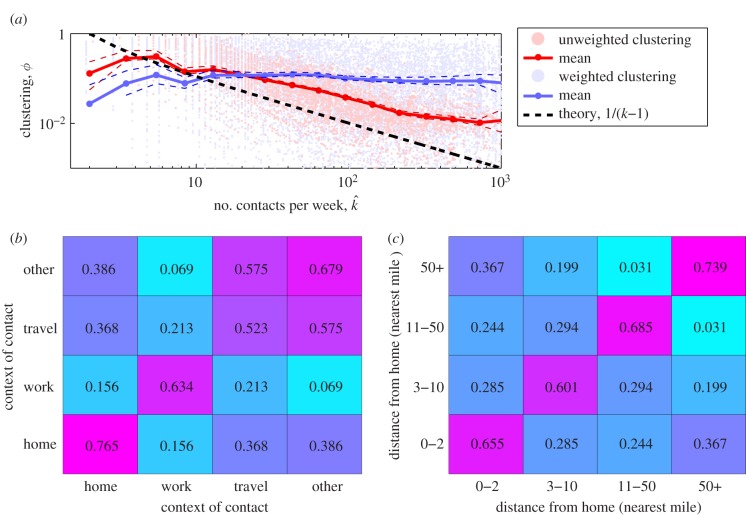
 , and the clustering between those contacts (red, unweighted; blue, weighted); confidence intervals are determined by bootstrapping. (b,c) Transitive matrices showing the degree of clustering stratified by social context and distance from home; the values are the proportion of transitive links between contacts in different setting compared with the theoretical maximum.
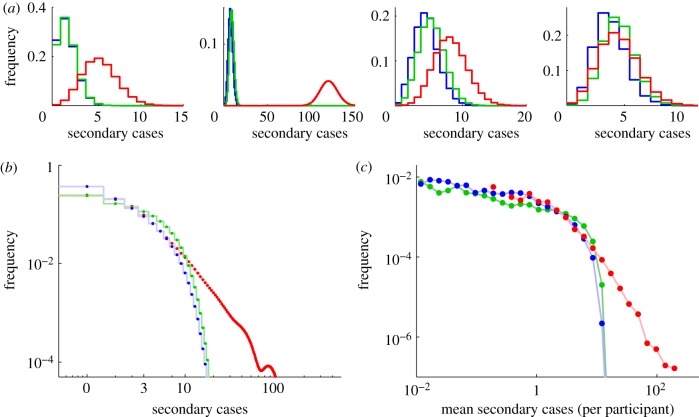
 ). We have modelled a short-lived, rapidly transmitted infection, with a latent period of 3 days, an infectious period of 3 days (
 ), and a transmission rate, τ, of 0.1 h− 1 across a network connection.
References
-
- May R. M. 2006. Network structure and the biology of populations. Trends Ecol. Evol. 21, 394–399 10.1016/j.tree.2006.03.013 (doi:10.1016/j.tree.2006.03.013) - DOI - DOI - PubMed
-
- Longini I. M., Nizam A., Xu S., Ungchusak K., Hanshaoworakul W., Cummings D. A. T., Halloran M. E. 2005. Containing pandemic influenza at the source. Science 309, 1083–1087 10.1126/science.1115717 (doi:10.1126/science.1115717) - DOI - DOI - PubMed
-
- Danon L., Ford A. P., House T., Jewell C. P., Keeling M. J., Roberts G. O., Ross J. V., Vernon M. C. 2011. Networks and the epidemiology of infectious disease. Interdiscip. Perspect. Infect. Dis. 2011, 284909 10.1155/2011/284909 (doi:10.1155/2011/284909) - DOI - DOI - PMC - PubMed
-
- Hufnagel L., Brockmann D., Geisel T. 2004. Forecast and control of epidemics in a globalized world. Proc. Natl Acad. Sci. USA 101, 15 124–15 129 10.1073/pnas.0308344101 (doi:10.1073/pnas.0308344101) - DOI - DOI - PMC - PubMed
-
- Hollingsworth T. D., Ferguson N. M., Anderson R. M. 2007. Frequent travelers and rate of spread of epidemics. Emerging Infect. Dis. 13, 1288–1294 10.3201/eid1309.070081 (doi:10.3201/eid1309.070081) - DOI - DOI - PMC - PubMed
Publication types
MeSH terms
Grants and funding
LinkOut - more resources
Full Text Sources
Medical