. 2012;8(6):e1002749.
doi: 10.1371/journal.pgen.1002749. Epub 2012 Jun 14.

Cohesin proteins promote ribosomal RNA production and protein translation in yeast and human cells

Affiliations

Cohesin proteins promote ribosomal RNA production and protein translation in yeast and human cells

Tania Bose et al. PLoS Genet. 2012.

Abstract

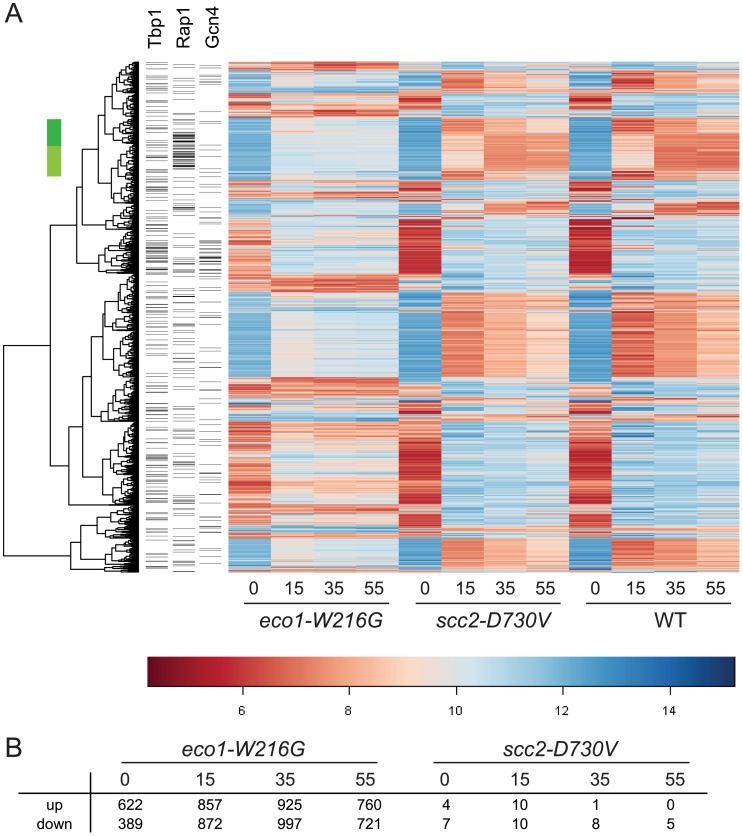
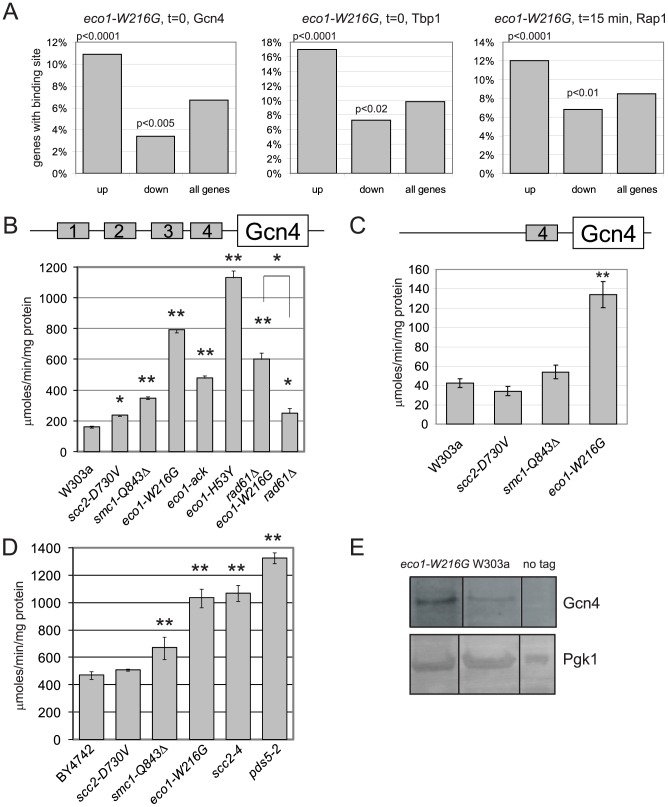
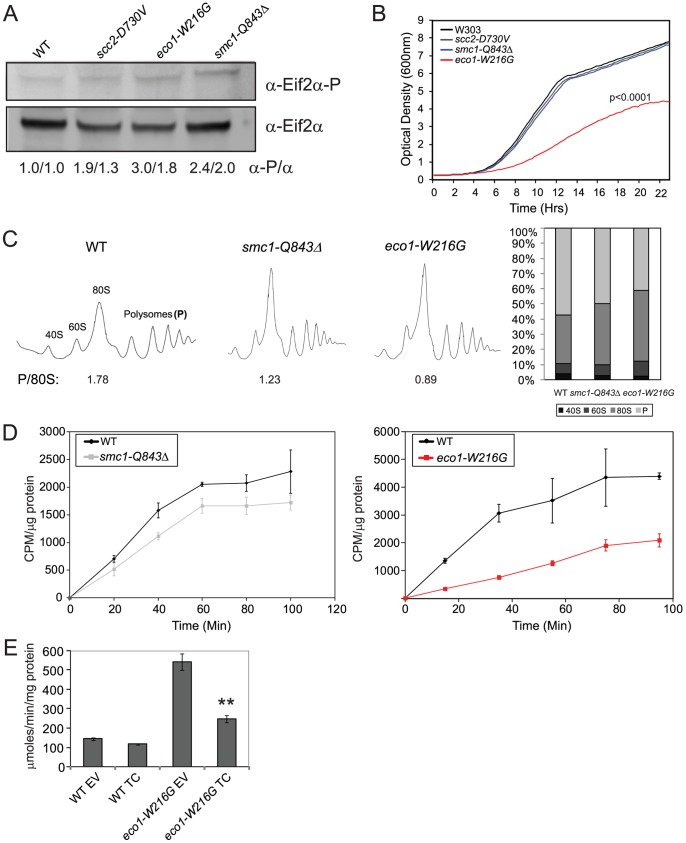
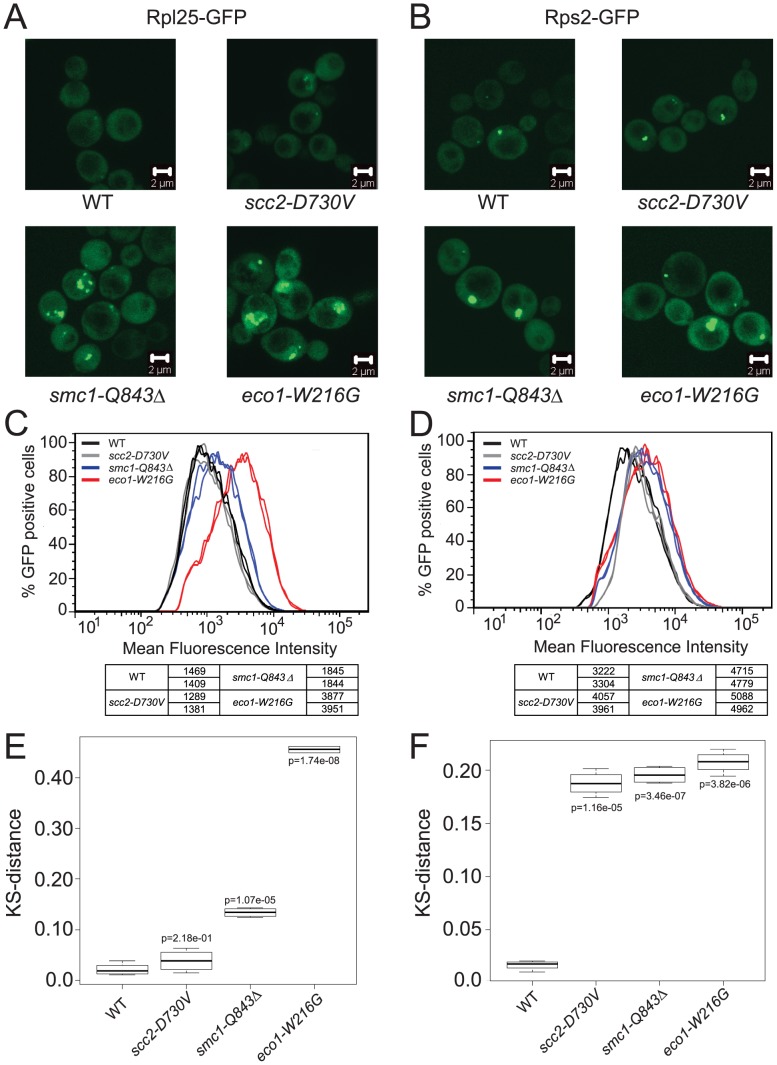
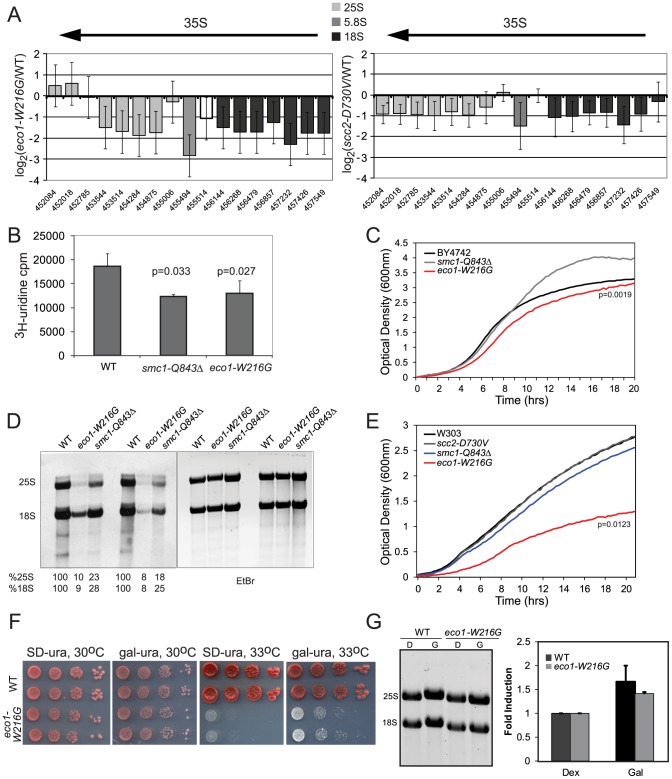
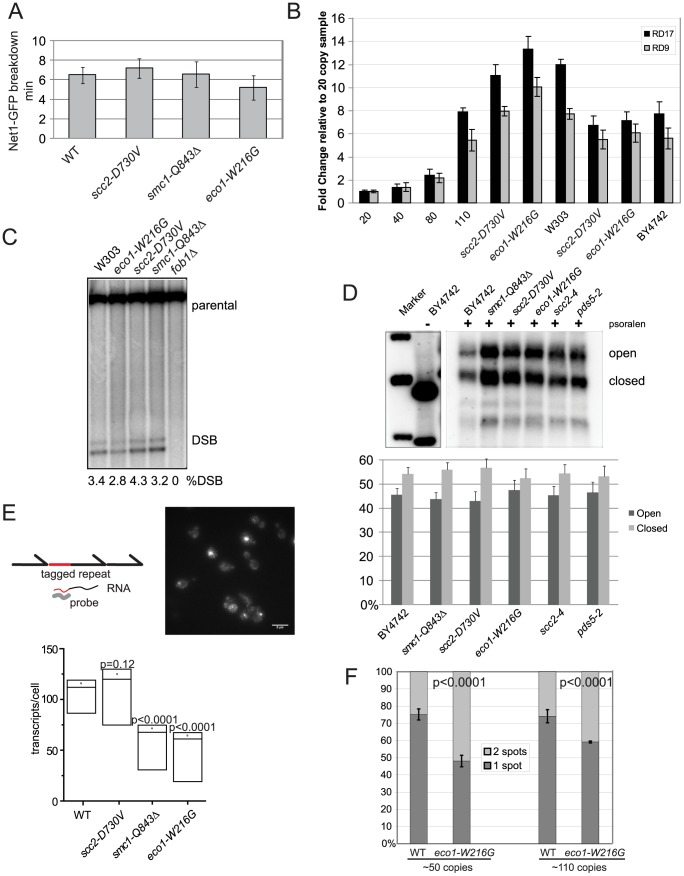
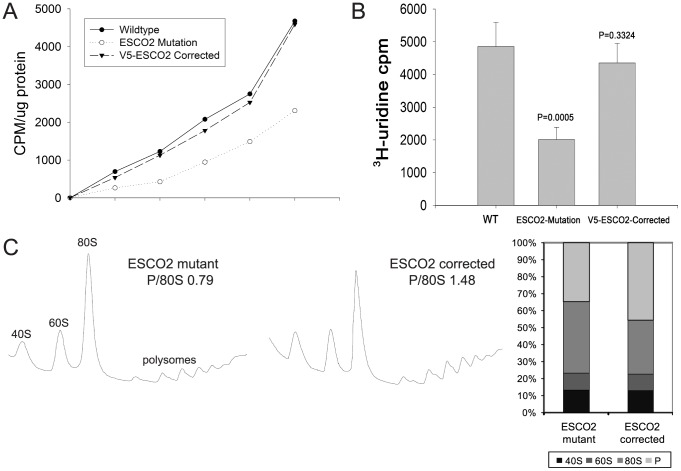
Cohesin is a protein complex known for its essential role in chromosome segregation. However, cohesin and associated factors have additional functions in transcription, DNA damage repair, and chromosome condensation. The human cohesinopathy diseases are thought to stem not from defects in chromosome segregation but from gene expression. The role of cohesin in gene expression is not well understood. We used budding yeast strains bearing mutations analogous to the human cohesinopathy disease alleles under control of their native promoter to study gene expression. These mutations do not significantly affect chromosome segregation. Transcriptional profiling reveals that many targets of the transcriptional activator Gcn4 are induced in the eco1-W216G mutant background. The upregulation of Gcn4 was observed in many cohesin mutants, and this observation suggested protein translation was reduced. We demonstrate that the cohesinopathy mutations eco1-W216G and smc1-Q843Δ are associated with defects in ribosome biogenesis and a reduction in the actively translating fraction of ribosomes, eiF2α-phosphorylation, and (35)S-methionine incorporation, all of which indicate a deficit in protein translation. Metabolic labeling shows that the eco1-W216G and smc1-Q843Δ mutants produce less ribosomal RNA, which is expected to constrain ribosome biogenesis. Further analysis shows that the production of rRNA from an individual repeat is reduced while copy number remains unchanged. Similar defects in rRNA production and protein translation are observed in a human Roberts syndrome cell line. In addition, cohesion is defective specifically at the rDNA locus in the eco1-W216G mutant, as has been previously reported for Roberts syndrome. Collectively, our data suggest that cohesin proteins normally facilitate production of ribosomal RNA and protein translation, and this is one way they can influence gene expression. Reduced translational capacity could contribute to the human cohesinopathies.


Conflict of interest statement

The authors have declared that no competing interests exist.

Figures

Figure 1
Figure 1. Gene expression is disrupted by the eco1-W216G mutation.
Haploid yeast strains (WT, scc2-D730V, eco1-W216G) were grown in triplicate to mid log phase in YPD+CSM (t 0 min) and then switched to synthetic medium lacking any amino acids and timepoints were collected at 15, 35, and 55 minutes. RNA from these cultures was labeled and hybridized to affymetrix microarrays. A. Hierarchical clustering of the 1657 genes with p<0.001 for eco1-W216G/WT comparison. The color bar is used to indicate the log2 of the array intensity for each gene which corresponds to transcript level. B. Table showing the number of genes up and down regulated with an adjusted p<0.05 for each timepoint for each mutant. See Table S1 for GO analysis of differentially expressed genes. See Figure S1 for evaluation of tRNA gene mediated silencing.
Figure 2
Figure 2. Gcn4 targets and Gcn4 are elevated in cohesin mutants.
A. Histogram for transcription factor binding sites from the eco1-W216G strain showing the number of genes upregulated or downregulated from Figure 1B that have a Gcn4 site (time 0), a Tbp1 site (time 0), or a Rap1 site (time 15 min). The p value is calculated by a hypergeometric test using the number of up or down regulated genes with the binding site versus the number of genes in the genome with the site. B. Strains with W303 background having the indicated mutations were transformed with the p180 reporter plasmid that contains a Gcn4-lacZ transgene. β-galactosidase levels (y axis) were measured for each strain in triplicate following growth to mid log phase in YPD+CSM. The error bars represent the standard deviation of at least three independent measurements. One asterisk indicates p less than or equal to 0.002, two asterisks indicates p<0.0001 from a Student's two tailed t test. C. β-galactosidase levels were measured using the p226 reporter. This construct has only the 4th uORF from the Gcn4 leader sequence, which confers minimal translational control. D. Strains with the BY4742 background with the indicated mutations were treated as in B. E. Gcn4 was tagged with the TAP epitope. Protein extracts from equal numbers of cells were used for Western blotting. Gcn4-TAP was detected with the α-PAP antibody. Pgk1 serves as a loading control. All samples were loaded on the same blot and subjected to the same exposure, but intervening lanes were removed. See Figure S2 for RT-qPCR confirmation of the misregulation of the Gcn4 targets SNO1 and SNZ1 in the mutants.
Figure 3
Figure 3. Cohesinopathy mutants display phenotypes consistent with translation defects.
A. Whole cell extracts were made from a WT, scc2-D730V, smc1-Q843Δ, and eco1-W216G mutant strains grown in YPD+CSM at 30°C. Extracts were used for Western blotting to measure levels of eiF2α protein, and phospho-eiF2α, which is an indicator of translational inhibition. Biological replicates yielded similar results (the first number corresponds to the blot shown). B. Growth profiles are shown for WT, scc2-D730V, smc1-Q843Δ, and eco1-W216G mutant strains. Profiles were collected at 15 minute intervals in triplicate for each strain in YPD+CSM at 30°C; a single curve is shown. We derived the maximum slope of the curves in log phase and tested whether the slopes were significantly different for replicates of the same genotype or for WT versus mutant (for more information see Materials and Methods). None of the curves derived from a single genotype showed statistical significance between replicates. The p value for the comparison to WT is indicated where significant. C. Polysome profiles of WT, smc1-Q843Δ, and eco1-W216G mutant strains were collected from cells grown in YPD+CSM at 30°C. The ratio of polysomes to 80S (P/80S) is shown. Profiling was conducted at least twice with similar results. Quantification was carried out using Mathematica and Image J software with similar results. Results from Image J analysis are shown. D. Strains growing in log phase in SD-met+35S-methionine at 30°C (see Figure 5E for growth profile) were used to measure protein synthesis. We verified that the cohesin mutants are not methionine auxotrophs. E. WT and eco1-W216G mutant strains with the Gcn4-lacZ transgene integrated at the TRP1 locus were transformed with either empty vector (EV) or a plasmid constitutively overexpressing the ternary complex (TC) by virtue of its high copy. Strains were grown and assayed as described in Figure 2. The difference between eco1-W216G+EV and eco1-W216G+TC was significant at p<0.0001. See Figure S3 for verification that the smc1-Q843Δ and eco1-W216G strains used throughout the manuscript are not aneuploid.
Figure 4
Figure 4. Cohesinopathy mutants show defects in ribosome biogenesis.
The indicated strains in the W303a background were transformed with a plasmid carrying either a reporter for the 60S subunit, Rpl25-GFP (A) or a reporter for the 40S subunit, Rps2-GFP (B). Images of live cells were collected using confocal microscopy (LSM 510 Axiovert; Carl Zeiss, Inc) with a 100× Plan Apochromat 1.46 NA oil objective, using AIM software. In order to quantify the fluorescence intensity, approximately 10,000 cells of each genotype were subjected to FACScan analysis and the peak GFP fluorescence was measured. For each genotype at least two independent samples were measured. Cultures were grown at 30°C in SD-leu supplemented with adenine and collected in log phase. The distribution of fluorescence is shown (C, D). A KS test was applied to the distributions (see Materials and Methods) and a t test was used to determine if the distance from WT (shown as a box plot) was statistically significant (E, F).
Figure 5
Figure 5. Cohesin mutations compromise production of ribosomal RNA.
A. The ratios for microarray probes corresponding to the 25S, 5.8S and 18S transcripts of the rDNA locus are shown for eco1-W216G/WT and scc2-D730V/WT at time 0 from Figure 1. The x axis corresponds to SGD coordinates, ordered by the beginning of the probe with the midpoint of the probe given. The arrow indicates the direction of transcription. The error bars show the standard error. B. Strains were in log phase in SD-ura at 30°C when an aliquot was removed and 3H-uridine was added for 5 min to equal numbers of cells for each strain background. Incorporation was measured by scintillation counting after extensive washing of the cells. Three independent cultures were labeled to derive the standard deviation. Significance was calculated using an unpaired t test. C. A growth curve is shown for the strains in SD-ura medium at 30°C. A similar experiment was performed in the W303a background and is included in Figure S4. D. Strains were grown in SD-met at 30°C and RNA was extracted from equal numbers of cells following a 5 minute pulse with 3H-methylmethionine and a chase with cold methionine. Equal amounts of RNA were run on a formaldehyde gel and photographed following staining with ethidium bromide (EtBr). Then the RNA was transferred to a membrane for exposure. Following exposure, the bands were excised and radioactivity was determined by scintillation counting. Percent incorporation is given as a fraction of WT. Independent biological replicates are shown. E. A growth curve is shown for the strains in SD-met medium at 30°C. F. Growth of the eco1-W216G mutant at 33°C is partially rescued by expression of the rDNA from a Pol II (gal) promoter. G. Total RNA was isolated from the strains shown following growth in raffinose followed by a 5.5. hour incubation with either glucose or galactose. The total amount of 28S+18S was quantified in glucose and galactose.
Figure 6
Figure 6. Cohesin mutations do not affect rDNA segregation, copy number, recombination, or the transcriptionally active fraction.
A. The length of time for segregation of the rDNA was measured in 10 cells using live cell imaging of Net1-GFP, a nucleolar marker. The average for each strain is shown in minutes and the error bars represent the standard deviation. B. Copy number at the rDNA was measured using quantitative PCR and genomic DNA from strains having the indicated genotypes. Two different primer pairs were used (RD17 and RD9) . The mean is shown and error bars indicate the standard deviation of triplicate reactions. C. Double strand breaks at the rDNA locus were monitored by Southern blot. Quantification is shown below each lane. This experiment was repeated twice with similar results. D. Psoralen crosslinking was performed followed by Southern blotting to determine the fraction of open (O) and closed (C) rDNA repeats. Quantification is shown. There were no significant difference between the mutants and WT strain. E. We used a strain in which a unique sequence has been inserted into one rDNA repeat in order to monitor its transcription by FISH . A standard curve allowed us to infer the number of RNA transcripts per cell (Figure S5). A representative image from the wild-type strain is shown; the scale bar is 5 microns. For more details please see Materials and Methods. For each strain, at least three independent cultures were monitored using the protocol previously described and at least 300 cells per culture were quantified. In the plot shown the dot is the average, the two lines around it are the standard error, and the lowest line is the median. The p value was derived from a two tailed Student's t test. See Figure S5 for the standard curve and expanded presentation of the FISH data. F. Cohesion was measured using strains with lacO repeats integrated adjacent to the rDNA cluster. Cultures were arrested with nocodazole. At least three biological replicates were performed, with at least 100 cells counted from each culture, and the standard deviation is shown. P values are derived from Fisher's test.
Figure 7
Figure 7. Metabolic labeling of Roberts syndrome fibroblasts suggests protein translation and ribosomal RNA production are reduced.
A. Cultured WT, ESCO2-mutation and V5- ESCO2-corrected human RBS fibroblasts were grown in F10 Ham Mixture plus 10% FBS. Cells were washed in PBS twice, switched to 3 mL Met/Cys-free Dulbecco's modied Eagle's medium containing 10 µM MG-132, a proteasome inhibitor, and pulsed with 30 µCi of 35S-methionine for different times (0, 15, 30, 60, 120, 240 min). Cells were lysed in RIPA buffer and proteins were precipitated by the addition of hot 10% TCA. After centrifugation, the precipitate was washed twice in acetone. The precipitate was dissolved in 100 µL of 1% SDS and heated at 95°C for 10 min. An aliquot of the SDS extract was counted in Esoscint for 35S radioactivity in a liquid scintillation spectrometer to determine the amount of 35S-methionine incorporated into proteins. B. Cultured WT, ESCO2-mutation and V5- ESCO2-corrected human RBS fibroblasts were grown in F10 Ham Mixture plus 10% FBS. 3H-uridine (5 µCi) was incubated with 106 cells from each group for two hours. Total RNA was isolated with TriZol reagent (Invitrogen, U.S.A) and the concentration of each RNA sample was measured by OD260/280. 1 µg of each sample was counted in a Beckman LS 6500 multipurpose scintillation counter to determine the amount of 3H-uridine incorporated. Four independent cultures were labeled to derive the standard deviation. Significance relative to WT was calculated using an unpaired t test. C. Ribosome profiling and quantification were carried out as described in Figure 3C.

References

    1. Ciosk R, Shirayama M, Shevchenko A, Tanaka T, Toth A, et al. Cohesin's binding to chromosomes depends on a separate complex consisting of Scc2 and Scc4 proteins. Mol Cell. 2000;5:243–254. - PubMed
    1. Gillespie PJ, Hirano T. Scc2 couples replication licensing to sister chromatid cohesion in Xenopus egg extracts. Curr Biol. 2004;14:1598–1603. - PubMed
    1. Takahashi TS, Yiu P, Chou MF, Gygi S, Walter JC. Recruitment of Xenopus Scc2 and cohesin to chromatin requires the pre-replication complex. Nat Cell Biol. 2004;6:991–996. - PubMed
    1. Ben-Shahar TR, Heeger S, Lehane C, East P, Flynn H, et al. Eco1-dependent cohesin acetylation during establishment of sister chromatid cohesion. Science. 2008;321:563–566. - PubMed
    1. Zhang J, Shi X, Li Y, Kim BJ, Jia J, et al. Acetylation of Smc3 by Eco1 is required for S phase sister chromatid cohesion in both human and yeast. Mol Cell. 2008;31:143–151. - PubMed

Publication types

MeSH terms

Substances

Supplementary concepts