. 2012 Jun 18:3:221.
doi: 10.3389/fmicb.2012.00221. eCollection 2012.

Modeling the habitat range of phototrophs in yellowstone national park: toward the development of a comprehensive fitness landscape

Affiliations

Modeling the habitat range of phototrophs in yellowstone national park: toward the development of a comprehensive fitness landscape

Eric S Boyd et al. Front Microbiol. .

Abstract

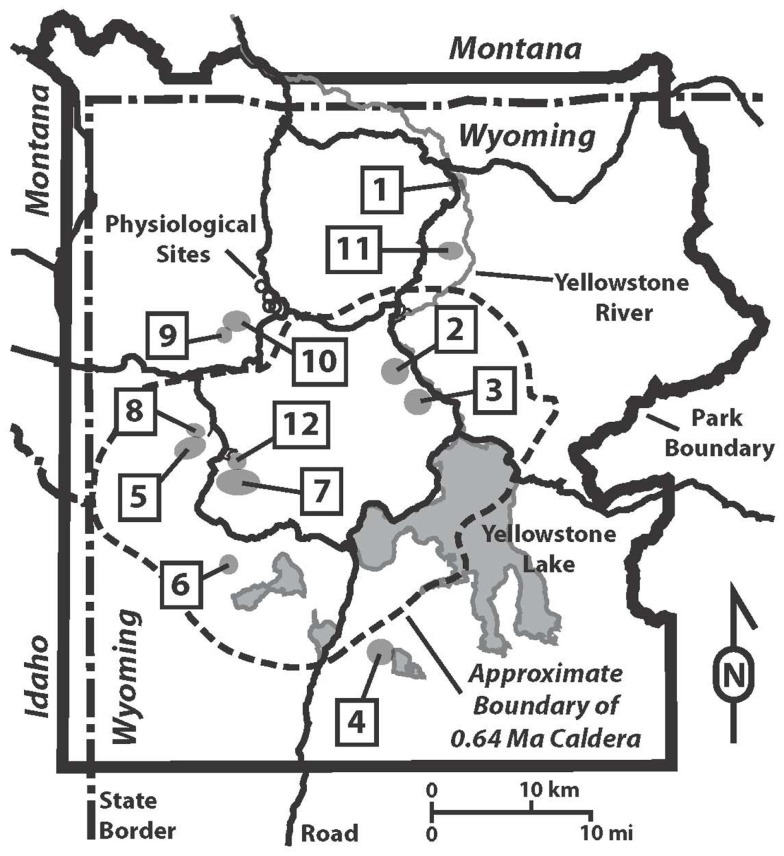
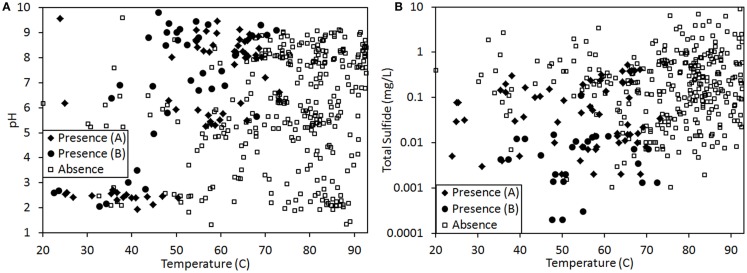
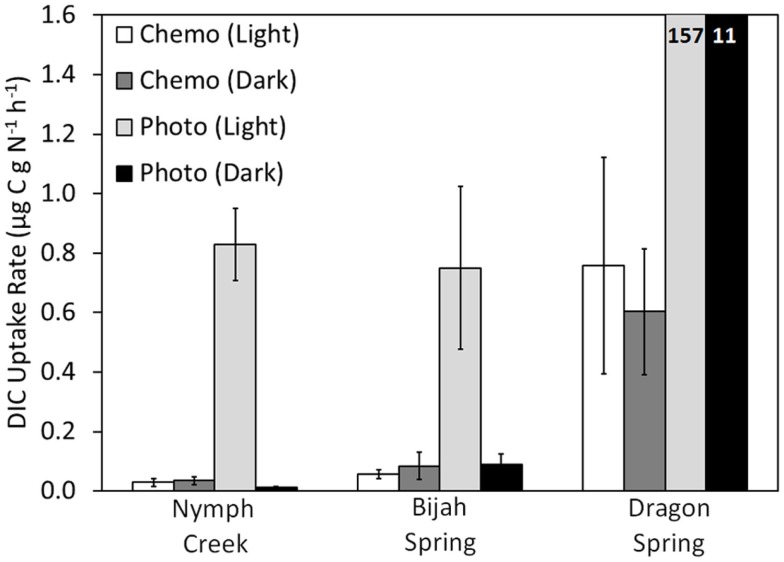
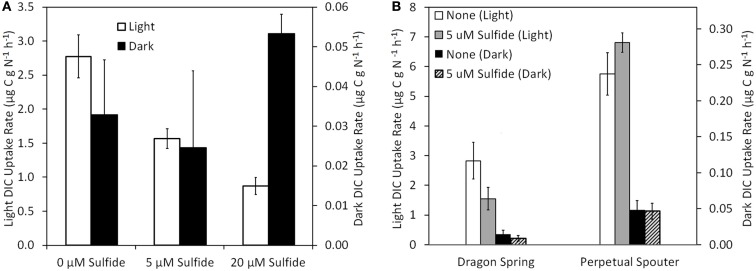
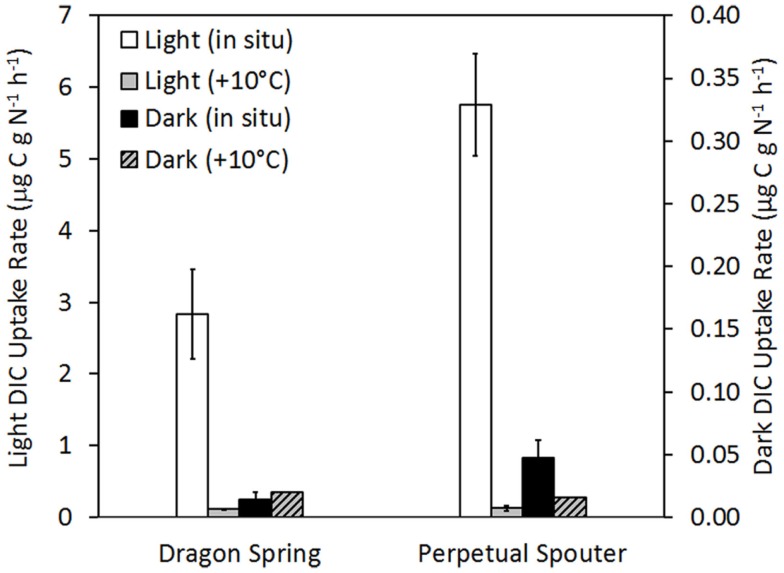
The extent to which geochemical variation shapes the distribution of phototrophic metabolisms was modeled based on 439 observations in geothermal springs in Yellowstone National Park (YNP), Wyoming. Generalized additive models (GAMs) were developed to predict the distribution of phototrophic metabolism as a function of spring temperature, pH, and total sulfide. GAMs comprised of temperature explained 38.8% of the variation in the distribution of phototrophic metabolism, whereas GAMs comprised of sulfide and pH explained 19.6 and 11.2% of the variation, respectively. These results suggest that of the measured variables, temperature is the primary constraint on the distribution of phototrophs in YNP. GAMs comprised of multiple variables explained a larger percentage of the variation in the distribution of phototrophic metabolism, indicating additive interactions among variables. A GAM that combined temperature and sulfide explained the greatest variation in the dataset (53.4%) while minimizing the introduction of degrees of freedom. In an effort to verify the extent to which phototroph distribution reflects constraints on activity, we examined the influence of sulfide and temperature on dissolved inorganic carbon (DIC) uptake rates under both light and dark conditions. Light-driven DIC uptake decreased systematically with increasing concentrations of sulfide in acidic, algal-dominated systems, but was unaffected in alkaline, cyanobacterial-dominated systems. In both alkaline and acidic systems, light-driven DIC uptake was suppressed in cultures incubated at temperatures 10°C greater than their in situ temperature. Collectively, these quantitative results indicate that apart from light availability, the habitat range of phototrophs in YNP springs is defined largely by constraints imposed firstly by temperature and secondly by sulfide on the activity of these populations that inhabit the edges of the habitat range. These findings are consistent with the predictions from GAMs and provide a quantitative framework from which to translate distributional patterns into fitness landscapes for use in interpreting the environmental constraints that have shaped the evolution of this process through Earth history.

Keywords: CO2 uptake and fixation; distribution; fitness landscape; habitat range; landscape ecology; photosynthesis; sulfide; temperature.


Figures

Figure 1
Figure 1
Map of Yellowstone National Park showing hydrothermal areas sampled and locations of physiological sites. Hydrothermal areas are numbered alphabetically: 1, Calcite Springs; 2, Crater Hills; 3, Obsidian Pool Area; 4, Heart Lake; 5, Imperial Geyser Basin; 6, Lone Star; 7, Rabbit Creek; 8, Sentinel Meadows; 9, South of Sylvan Springs; 10, Sylvan Springs; 11, Washburn; 12, White Creek. Physiological samples, represented with open circles, in order from Northwest to Southeast are Bijah Spring, Nymph Creek, Dragon Spring, and Perpetual Spouter.
Figure 2
Figure 2
Presence (♦, for samples assessed via visual inspection for pigments; ●, for samples assessed via genetic technique; see Materials and Methods for further description) and absence (□) of phototrophic pigments and/or genes involved in their synthesis in 439 geothermal springs in YNP plotted as a function of spring temperature and pH (A) or spring temperature and total sulfide concentration (B). Total sulfide concentration is plotted on a log plot.
Figure 3
Figure 3
The photosynthetic fringe, or the transition from chemosynthetic to photosynthetic metabolism, as denoted by arrows, for Bijah Spring in March 2010 (A), Dragon Spring in March 2010 (B), Nymph Creek in March 2010 (C), and Perpetual Spouter in August of 2011 (D).
Figure 4
Figure 4
Rate of DIC uptake for chemotrophic and phototrophic assemblages sampled from adjacent sides of the photosynthetic fringe in Nymph Creek (fringe pH = 2.99, Temp. = 52.7°C), Bijah Spring (fringe pH = 7.40, Temp. = 70.0°C), and Dragon Spring (fringe pH = 2.95, Temp. = 46.5°C). Microcosms were incubated both in the light and the dark and rates reflect the difference between triplicate killed controls and triplicate biological controls, for each treatment. For comparative purposes, DIC uptake rates were normalized to grams organic nitrogen present in the chemotrophic or phototrophic biomass used as inoculum (Table 1). All spring water used in the microcosms was sampled from the photosynthetic fringe and all microcosms were incubated in situ at the photosynthetic fringe temperature. Rates of DIC uptake for the phototrophic assemblages sampled from Dragon Spring are indicated as insets on the histogram.
Figure 5
Figure 5
Rate of DIC uptake in phototrophic assemblages sampled from near (<1 cm) the photosynthetic fringe at Nymph Creek (fringe pH = 2.89, Temp. = 52.1°C, total sulfide ≤ 150 nM) as a function of increasing amendment of sodium sulfide to final concentrations of 5 and 20 μM when incubated under light and dark conditions (A). Rate of DIC uptake in photosynthetic assemblages sampled from near (<1 cm) the photosynthetic fringe at Dragon Spring (fringe pH = 2.60, Temp. = 46.2°C, total sulfide = ∼1 μM) and Perpetual Spouter (fringe pH = 7.12, Temp. = 68.6°C, total sulfide ≤ 150 nM) as a function of amendment of sodium sulfide to final concentrations of 5 μM when incubated under light and dark conditions (B). All spring water used in inoculums was sampled from the photosynthetic fringe and rates of DIC uptake were normalized to grams of organic nitrogen present in the biomass used as inoculum (Table 1).
Figure 6
Figure 6
Rate of DIC uptake in phototrophic assemblages sampled from near the photosynthetic fringe at Dragon Spring (fringe pH = 2.60, Temp. = 46.2°C, total sulfide = ∼1 μM) and Perpetual Spouter (fringe pH = 7.12, Temp. = 68.6°C, total sulfide ≤ 150 nM) when incubated at the fringe temperature as well as at a temperature ∼10°C greater than at the fringe temperature (58.0 and 78.4°C, respectively), under both light and dark conditions. All spring water used in microcosms was sampled from near the photosynthetic fringe and rates of DIC uptake were normalized to grams organic nitrogen in biomass that served as inoculum (Table 1).

References

    1. Allewalt J. P., Bateson M. M., Revsbech N. P., Slack K., Ward D. M. (2006). Effect of temperature and light on growth of and photosynthesis by Synechococcus isolates typical of those predominating in the Octopus Spring microbial mat community of Yellowstone National Park. Appl. Environ. Microbiol. 72, 544–550 10.1128/AEM.72.1.544-550.2006 - DOI - PMC - PubMed
    1. Amend J. P., Shock E. L. (2001). Energetics of overall metabolic reactions of thermophilic and hyperthermophilic archaea and bacteria. FEMS Microbiol. Rev. 25, 175–243 10.1111/j.1574-6976.2001.tb00576.x - DOI - PubMed
    1. Anbar A. D. (2008). Elements and evolution. Science 322, 1481–1483 10.1126/science.1163100 - DOI - PubMed
    1. Anbar A. D., Duan Y., Lyons T. W., Arnold G. L., Kendall B., Creaser R. A., Kaufman A. J., Gordon G. W., Scott C., Garvin J., Buick R. (2007). A whiff of oxygen before the great oxidation event? Science 317, 1903–1906 10.1126/science.1140325 - DOI - PubMed
    1. Barkay T., Kritee K., Boyd E., Geesey G. (2010). A thermophilic bacterial origin and subsequent constraints by redox, light and salinity on the evolution of the microbial mercuric reductase. Environ. Microbiol. 12, 2904–2917 10.1111/j.1462-2920.2010.02260.x - DOI - PubMed

LinkOut - more resources