. 2012:2012:491685.
doi: 10.1155/2012/491685. Epub 2012 Jun 7.

Acquiring Metastatic Competence by Oral Squamous Cell Carcinoma Cells Is Associated with Differential Expression of α-Tubulin Isoforms

Affiliations

Acquiring Metastatic Competence by Oral Squamous Cell Carcinoma Cells Is Associated with Differential Expression of α-Tubulin Isoforms

Becky Lou et al. J Oncol. 2012.

Abstract

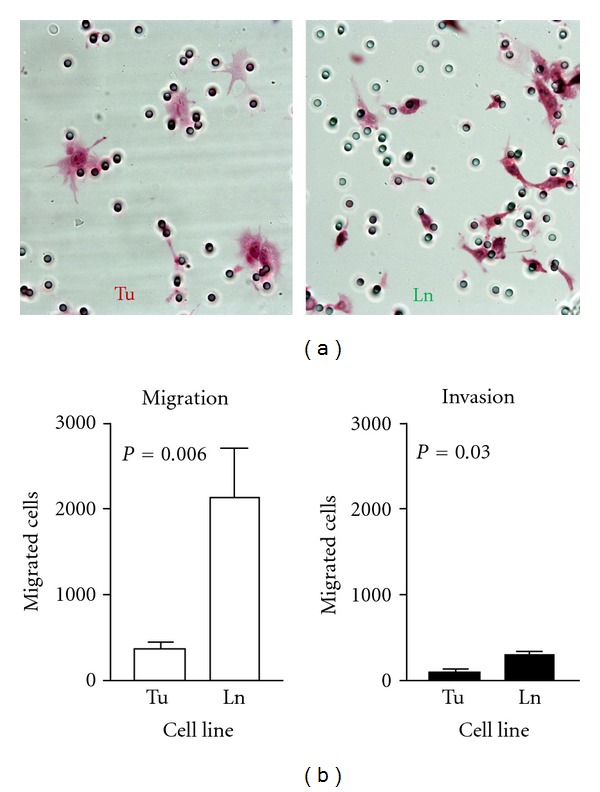
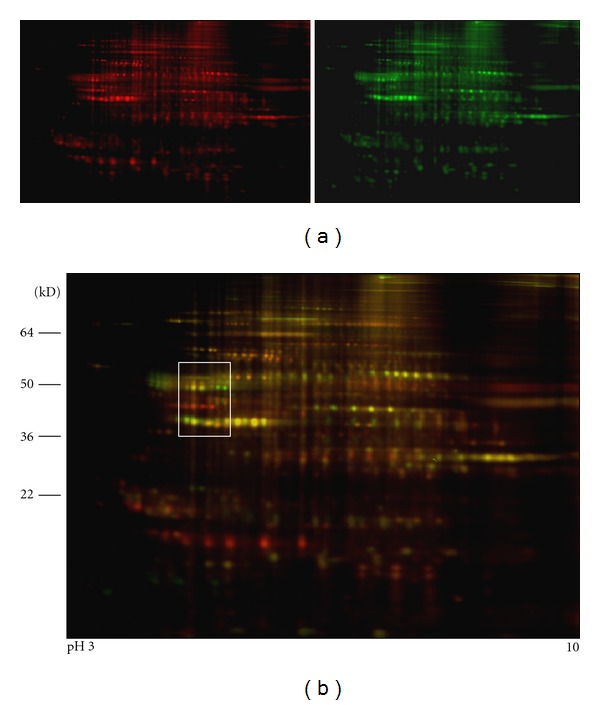
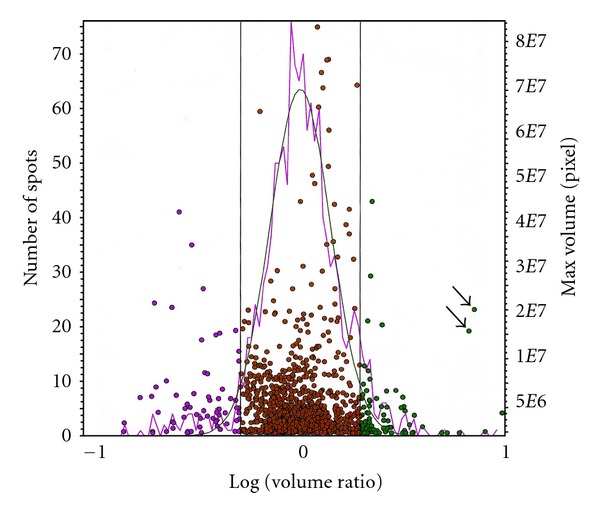
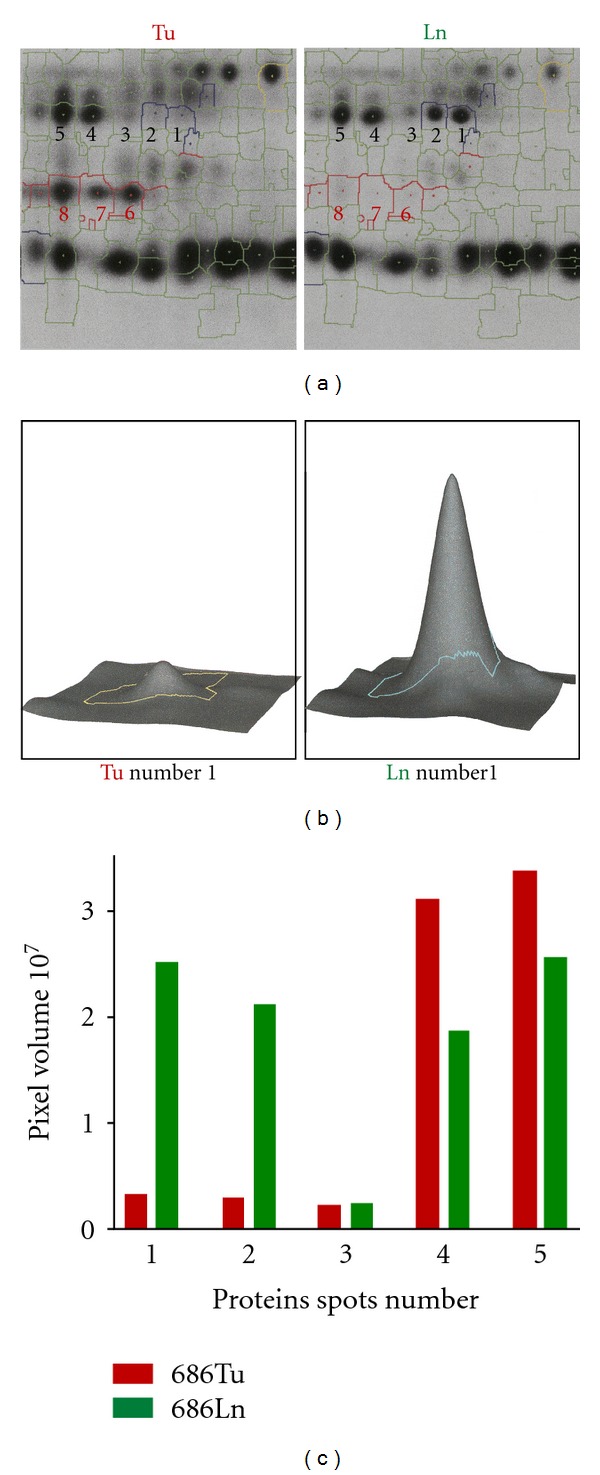
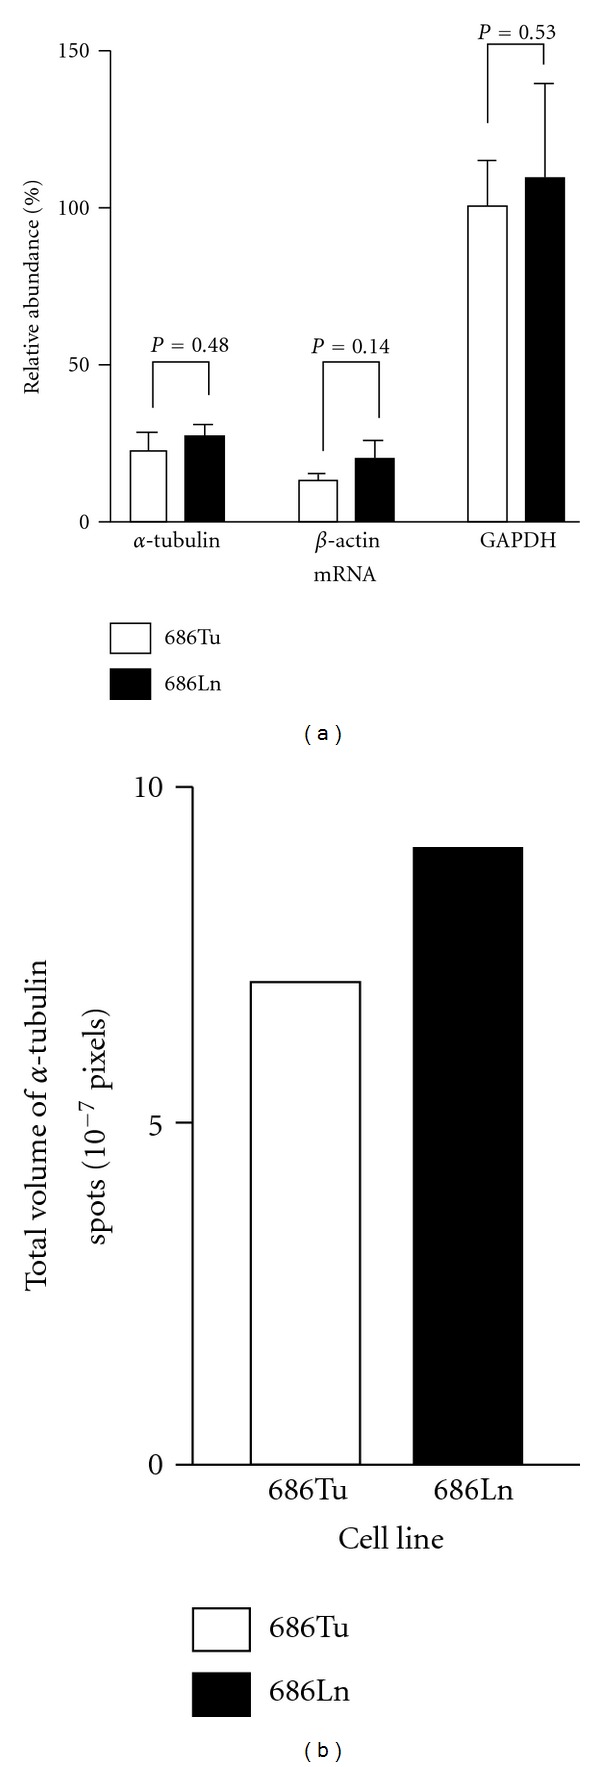
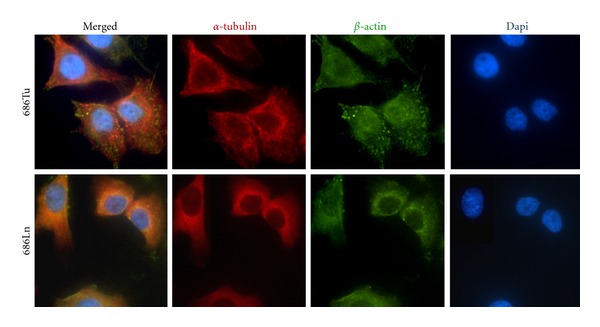
We performed comparative global proteomics analyses of patient-matched primary (686Tu) and metastatic (686Ln) OSCC cells. The metastatic OSCC 686Ln cells showed greater in vitro migratory/invasive potential and distinct cell shape from their parental primary 686Tu cells. Ettan DIGE analysis revealed 1316 proteins spots in both cell lines with >85% to be quantitatively similar (<2 folds) between the two cell lines. However, two protein spots among four serial spots were highly dominant in 686Ln cells. Mass spectrometry sequencing demonstrated all four spots to be α-tubulin isotypes. Further analysis showed no significant quantitative difference in the α-tubulin between the two cell lines either at mRNA or protein levels. Thus, two distinct isoforms of α-tubulin, probably due to posttranslational modification, were associated with metastatic 686Ln cells. Immunofluorescence demonstrated remarkable differences in the cytosolic α-tubulin distribution patterns between the two cells. In 686Tu cells, α-tubulin proteins formed a normal network composed of filaments. In contrast, α-tubulin in 686Ln cells exhibited only partial cytoskeletal distribution with the majority of the protein diffusely distributed within the cytosol. Since α-tubulin is critical for cell shape and mobility, our finding suggests a role of α-tubulin isoforms in acquisition of metastatic phenotype and represents potential target for therapeutic intervention.


Figures

Figure 1
Figure 1
Metastatic OSSC 686Ln cells have higher invasion potentials than primary 686Tu cells. (a) Morphology of migrated OSSC 686Tu (Tu, left panel) and 686Ln cells (Ln, right panel) on the filter after H-E staining during migration assay. Pores on the filter are visible: ×300. (b) Summary of invasion potentials of 686Tu (Tu) and 686Ln (Ln) cells in migration and invasion assays as indicated at the top of each graph. Invasion potentials are expressed as numbers of migrated cells in each well.
Figure 2
Figure 2
DIGE gel images of primary OSSC 686Tu and metastatic 686Ln cells. (a) Cy5 image (red, left panel) and Cy3 image (green, right panel) for 686Tu (Tu) and 686Ln (Ln), respectively. (b) Merged Cy5 and Cy3 image. Rectangular area, outlined by white line, would be further discussed. Note that some spots in the area appear pure green or red color, suggesting their uneven quantities in the two cells.
Figure 3
Figure 3
Scattergram depiction of DIGE data to generate protein expression profile of 686Tu and 686Ln cells. Each dot represents a protein detected in 686Tu and 686Ln cells. The dots are expressed as bigger pixel volume in either cell (right Y-axis), and plotted against log scale of pixel volume ratio between 686Tu and 686Ln (X axis), with 686Tu as standard. Two vertical lines indicate two-fold difference limits between the two cells. Left Y-axis is number of spots at certain pixel ranges. Related pink curve is actual distribution of spots versus their pixel volume ratio and green curve is normalized Gaussian distribution (R 2 = 0.963). Arrows indicate two protein spots to be studied.
Figure 4
Figure 4
Comparison of protein spots between 686Tu and 686Ln cells in rectangular area (see Figure 1(b)). (a) Enlarged images of interested area for 686Tu (Tu, left panel) and 686Ln cells (Ln, right panel). Some spots are numbered. Note that spots number 1 and 2 are absent in 686Tu cells, while number 6, 7, and 8 are missing in 686Ln. (b) 3D simulation of spot number 1 in 686Tu and 686Ln cells. (c) Comparison of pixel volumes of spots number 1 to 5 between the two cells. Pixel volumes are calculated with 3D simulation.
Figure 5
Figure 5
686Tu and 686Ln cells expressed comparable levels of α-tubulin. (a) Quantitative RT-PCR detection of mRNA for the genes as indicated in 686Tu and 686Ln cells. The quantities of mRNA are expressed as relative abundance using GAPDH in 686Tu as 100%. (b) Total pixel volumes of α-tubulin in 686Tu and 686Ln cells.
Figure 6
Figure 6
Metastatic 686Ln and primary 686Tu cells show a different cellular distribution pattern of α-tubulin. 686Tu (Tu, upper row) or 686Ln cells (Ln, lower row) were stained for α-tubulin (red) and β actin (green). The cells were counterstained by DAPI. Note that 686Ln cells show defuse α-tubulin distribution, in contrast to filament network in 686Tu cells ×600.

Similar articles

Cited by

References

    1. Leemans CR, Tiwari R, Nauta JJ, van der Waal I, Snow GB. Regional lymph node involvement and its significance in the development of distant metastases in head and neck carcinoma. Cancer. 1993;71(2):452–456. - PubMed
    1. Stacker SA, Achen MG, Jussila L, Baldwin ME, Alitalo K. Metastasis: lymphangiogenesis and cancer metastasis. Nature Reviews Cancer. 2002;2(8):573–583. - PubMed
    1. Chiang AC, Massagué J. Molecular basis of metastasis. The New England Journal of Medicine. 2008;359(26):2814–2823. - PMC - PubMed
    1. Chaffer CL, Weinberg RA. A perspective on cancer cell metastasis. Science. 2011;331(6024):1559–1564. - PubMed
    1. Nowell PC. The clonal evolution of tumor cell populations. Science. 1976;194(4260):23–28. - PubMed

LinkOut - more resources