

Complex carbohydrate utilization by the healthy human microbiome
- PMID: 22719820
- PMCID: PMC3374616
- DOI: 10.1371/journal.pone.0028742
Complex carbohydrate utilization by the healthy human microbiome
Abstract
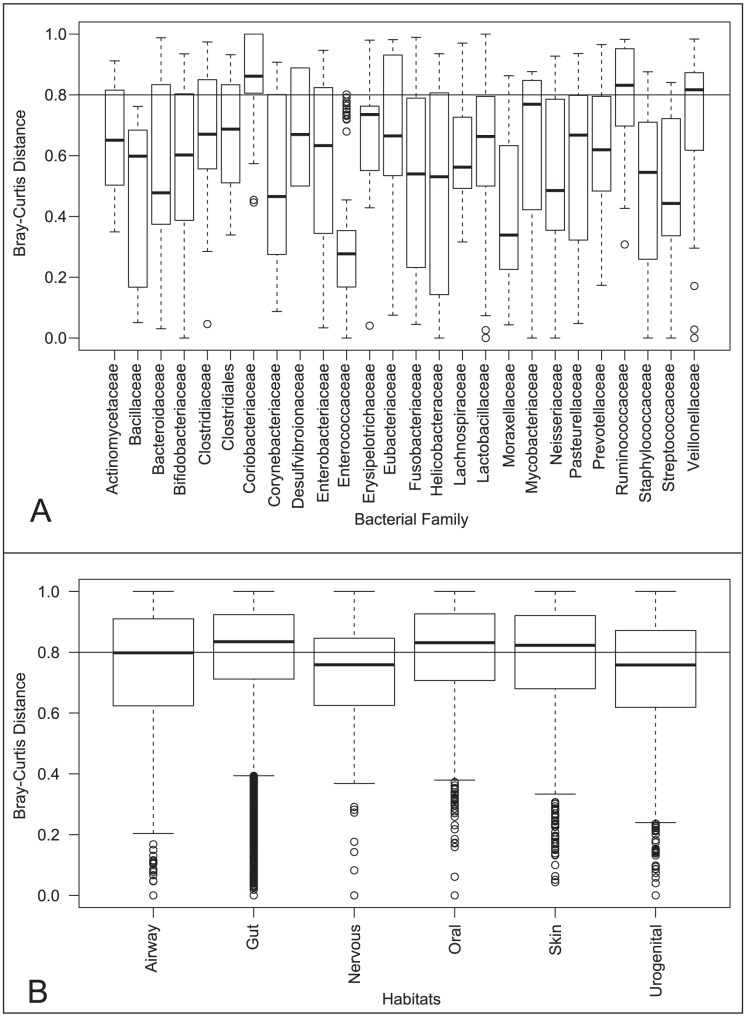
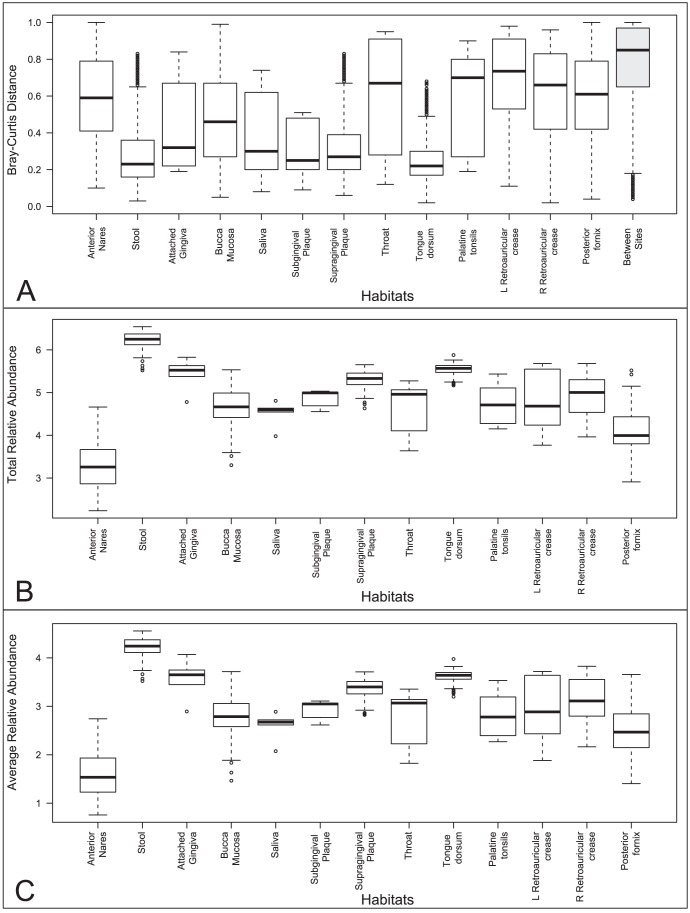
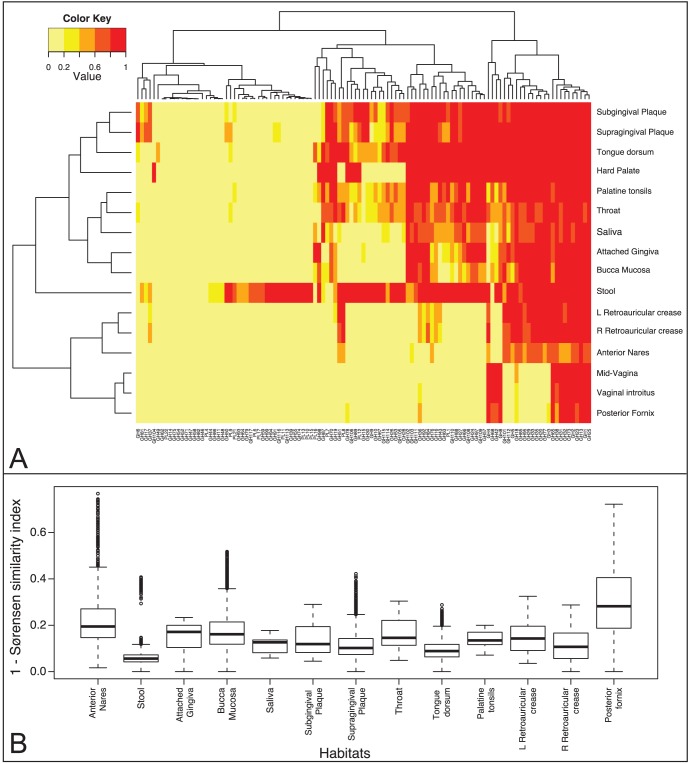
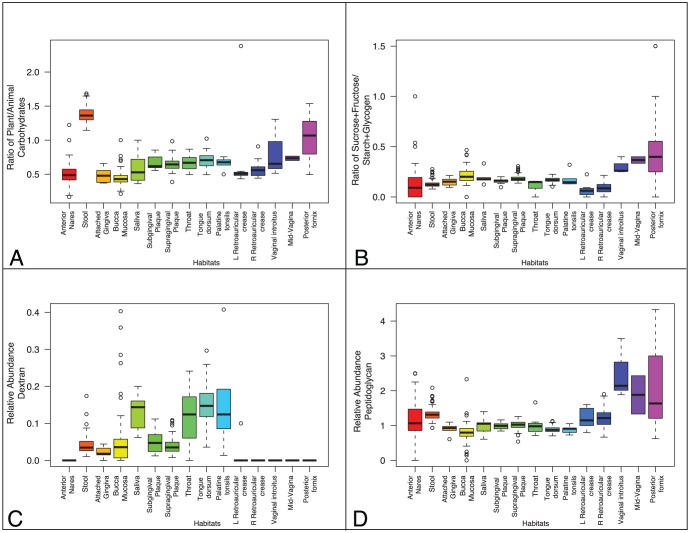
The various ecological habitats in the human body provide microbes a wide array of nutrient sources and survival challenges. Advances in technology such as DNA sequencing have allowed a deeper perspective into the molecular function of the human microbiota than has been achievable in the past. Here we aimed to examine the enzymes that cleave complex carbohydrates (CAZymes) in the human microbiome in order to determine (i) whether the CAZyme profiles of bacterial genomes are more similar within body sites or bacterial families and (ii) the sugar degradation and utilization capabilities of microbial communities inhabiting various human habitats. Upon examination of 493 bacterial references genomes from 12 human habitats, we found that sugar degradation capabilities of taxa are more similar to others in the same bacterial family than to those inhabiting the same habitat. Yet, the analysis of 520 metagenomic samples from five major body sites show that even when the community composition varies the CAZyme profiles are very similar within a body site, suggesting that the observed functional profile and microbial habitation have adapted to the local carbohydrate composition. When broad sugar utilization was compared within the five major body sites, the gastrointestinal track contained the highest potential for total sugar degradation, while dextran and peptidoglycan degradation were highest in oral and vaginal sites respectively. Our analysis suggests that the carbohydrate composition of each body site has a profound influence and probably constitutes one of the major driving forces that shapes the community composition and therefore the CAZyme profile of the local microbial communities, which in turn reflects the microbiome fitness to a body site.
Conflict of interest statement
Figures
References
-
- Hu Y, Walker S. Remarkable structural similarities between diverse glycosyltransferases. Chem Biol. 2002;9:1287–1296. - PubMed
-
- Laine RA. A calculation of all possible oligosaccharide isomers both branched and linear yields 1.05 x 10(12) structures for a reducing hexasaccharide: the Isomer Barrier to development of single-method saccharide sequencing or synthesis systems. Glycobiology. 1994;4:759–767. - PubMed
-
- Varki A, Sharon N. Historical Background and Overview. 2009. - PubMed
-
- Varki A. Essentials of glycobiology. Cold Spring Harbor, NY: Cold Spring Harbor Laboratory Press. xvii, 653 p. p. 1999.
-
- Hooper LV, Midtvedt T, Gordon JI. How host-microbial interactions shape the nutrient environment of the mammalian intestine. Annu Rev Nutr. 2002;22:283–307. - PubMed
Publication types
MeSH terms
Grants and funding
LinkOut - more resources
Full Text Sources
Other Literature Sources
Miscellaneous
