. 2012;7(6):e37809.
doi: 10.1371/journal.pone.0037809. Epub 2012 Jun 18.

Quality coding by neural populations in the early olfactory pathway: analysis using information theory and lessons for artificial olfactory systems

Affiliations

Quality coding by neural populations in the early olfactory pathway: analysis using information theory and lessons for artificial olfactory systems

Jordi Fonollosa et al. PLoS One. 2012.

Abstract

In this article, we analyze the ability of the early olfactory system to detect and discriminate different odors by means of information theory measurements applied to olfactory bulb activity images. We have studied the role that the diversity and number of receptor neuron types play in encoding chemical information. Our results show that the olfactory receptors of the biological system are low correlated and present good coverage of the input space. The coding capacity of ensembles of olfactory receptors with the same receptive range is maximized when the receptors cover half of the odor input space - a configuration that corresponds to receptors that are not particularly selective. However, the ensemble's performance slightly increases when mixing uncorrelated receptors of different receptive ranges. Our results confirm that the low correlation between sensors could be more significant than the sensor selectivity for general purpose chemo-sensory systems, whether these are biological or biomimetic.


Conflict of interest statement

Competing Interests: The authors have declared that no competing interests exist.

Figures

Figure 1
Figure 1. Method to estimate the coding capacity of groups of receptors.
This is the routine to calculate the MI for different receptor type ensembles. In step 1 we set the number and the RR of receptors. In step 2 we randomly select the stimuli and receptors from the database. In step 3, the stimulus-response map is calculated, and reversed in step 4 to calculate MI. We select a new set of receptors (of the same type) and stimuli and repeat the cycle thousands of times. We obtain the histogram of MI and we calculate the mean value and the standard deviation of the values obtained for the same type of receptors (step 5). Then, we change the number and the RR of receptors (step 1) and compute the routine again. Finally, in step 6, we plot the performance of the ensemble across the type of receptors.
Figure 2
Figure 2. Interrelationship among receptive range, selectivity and correlation of olfactory receptors.
Top: Selectivity and correlation of olfactory receptors. The odor space and the RR of the receptors are represented by the dashed-square and the black squares respectively. Two different 10-receptor arrays are created: with narrowly (left) and broadly (center) tuned receptors. Narrowly tuned receptors may be less correlated, while broadly tuned receptors cover a larger area of the odor space and respond to a larger number of odorants. While broad RR receptors could be more correlated (more overlap between receptors), receptors with small RR may also be correlated (right). Bottom: Receptive range distribution. Receptive range (RR) distribution for the 1,778 active receptors. More selective receptors respond to a lower number of odorants (low RR) and broadly tuned receptors show a “positive response” to most of the odorants (high RR). Total of different odorants tested: 339.
Figure 3
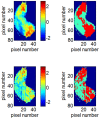
Figure 3. Olfactory bulb activity images.
The olfactory bulb activity measured gives a pattern obtained using uptake of [14C]-2DG when exposed to 2-ethylfuran (up, left) and exposed to 1,7-octadiene (bottom, left). The corresponding binary map of the olfactory bulb activity for 2-ethylfuran (top, right) and for 1,7-octadiene (bottom, right). Red: “positive response”, sky-blue: “null response”, dark-blue: background.
Figure 4
Figure 4. Mutual Information for odor coding.
Top: Mean performance of different sized arrays of receptors and different receptive range. Mean and standard deviation (after 1,000 repetitions) of the evaluated coding capacity for homogenous groups of 4, 5, 6, 7, 8, 9, 10, 11, and 12 receptors for different RR of the receptors. The MI was calculated with sets of 256 stimuli, which limit the maximum array performance to 8 bits. The coding capacity increases with the number of receptors and there is an optimum coding capacity when the RR is about 50%. More selective (less RR) or less selective (more RR) gives a degraded performance. Bottom. Performance distribution of a 12-receptor array. Distribution of calculated MI for a 12-receptor array and 53% RR, after 1,000 trials. The histogram corresponds to step 5 of the routine (see figure 1) and is used to calculate the mean performance and standard deviation of the ensemble (top).
Figure 5
Figure 5. Maximum Mutual Information across a number of receptors.
The coding capacity increases for larger ensembles of receptors. However, the MI is bound by the maximum entropy of the discrimination task, in this case 256 stimuli (8 bits).
Figure 6
Figure 6. Array performance of heterogeneous ensembles.
Mean and standard deviation (after 1,000 repetitions) when mixing receptors with RR = 59.0% and receptors with RR = 41.3%. Dashed horizontal lines show the maximum performance for 8 and 12 receptors when limited to homogenous arrays. Heterogeneous mixtures perform 0.15 bits better than homogenous arrays.
Figure 7
Figure 7. Correlation between pairs of sensors of similar receptive range.
Mean correlation (after 2,000 repetitions) between pairs of sensors of similar RR, for the theoretical model of Alkasab et al. (blue) and for the measured data across the rat olfactory bulb (red). Biological data show low correlation values (always below 0.4).
Figure 8
Figure 8. Receptive range of the rat olfactory receptors measured across the olfactory bulb.
Less selective receptors are grouped in the medial-caudal and lateral-caudal parts of the olfactory bulb while selective receptors are located in the ventral region.

References

    1. Gardner JW, Bartlett PN. A brief history of electronic noses. Sensors and Actuators B: Chemical. 1994;18:210–211.
    1. Fonollosa J, Gutierrez-Galvez A, Lansner A, Martinez D, Rospars JP, et al. Biologically Inspired Computation for Chemical Sensing. Procedia Computer Science. 2011;7:226–227.
    1. Barlow HB. Possible principles underlying the transformation of sensory messages. Sensory Communication MIT Press. 1961. pp. 217–234.
    1. Kostal L, Lansky P, Rospars JP. Efficient olfactory coding in the pheromone receptor neuron of a moth. Plos Computational Biology 4. 2008. - PMC - PubMed
    1. Vassar R, Chao SK, Sitcheran R, Nunez JM, Vosshall LB, et al. Topographic organization of sensory projections to the olfactory-bulb. Cell. 1994;79:981–991. - PubMed

Publication types