. 2012;7(6):e38756.
doi: 10.1371/journal.pone.0038756. Epub 2012 Jun 13.

Regulation of classical cadherin membrane expression and F-actin assembly by alpha-catenins, during Xenopus embryogenesis

Affiliations

Regulation of classical cadherin membrane expression and F-actin assembly by alpha-catenins, during Xenopus embryogenesis

Sumeda Nandadasa et al. PLoS One. 2012.

Abstract

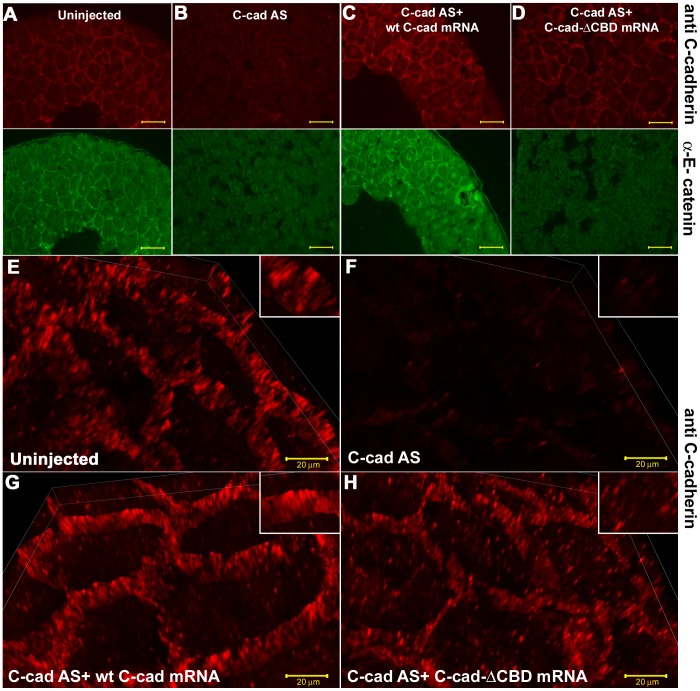
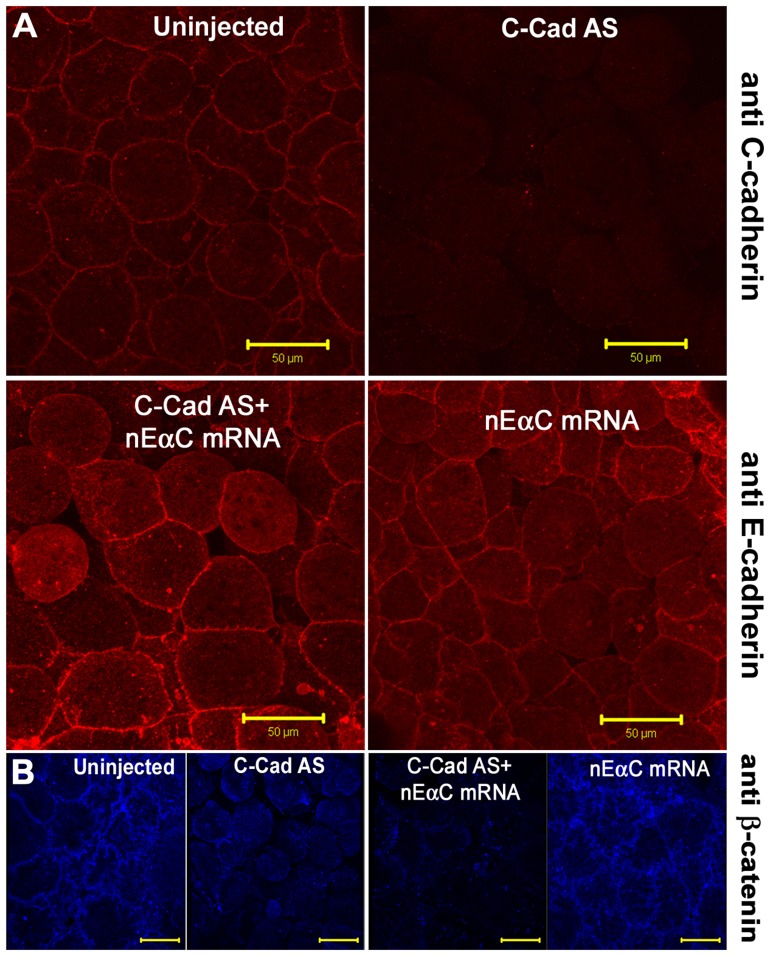
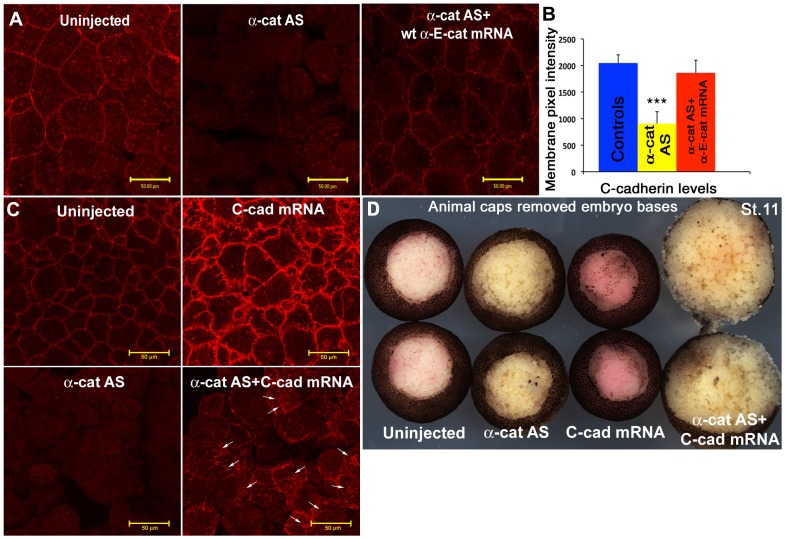
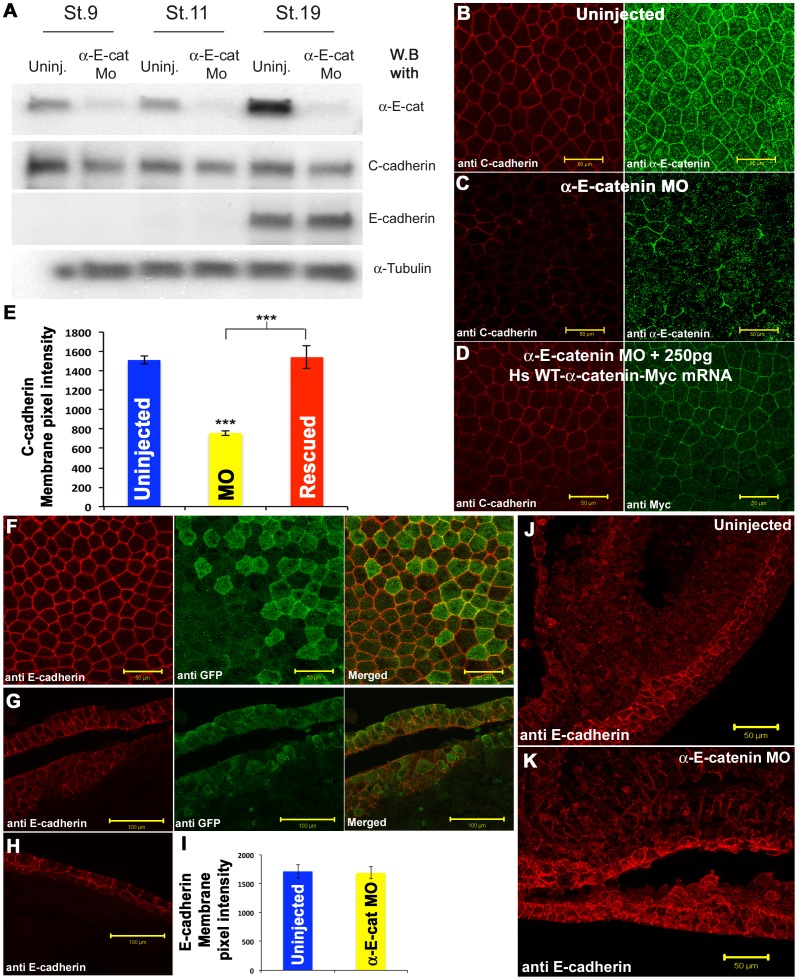
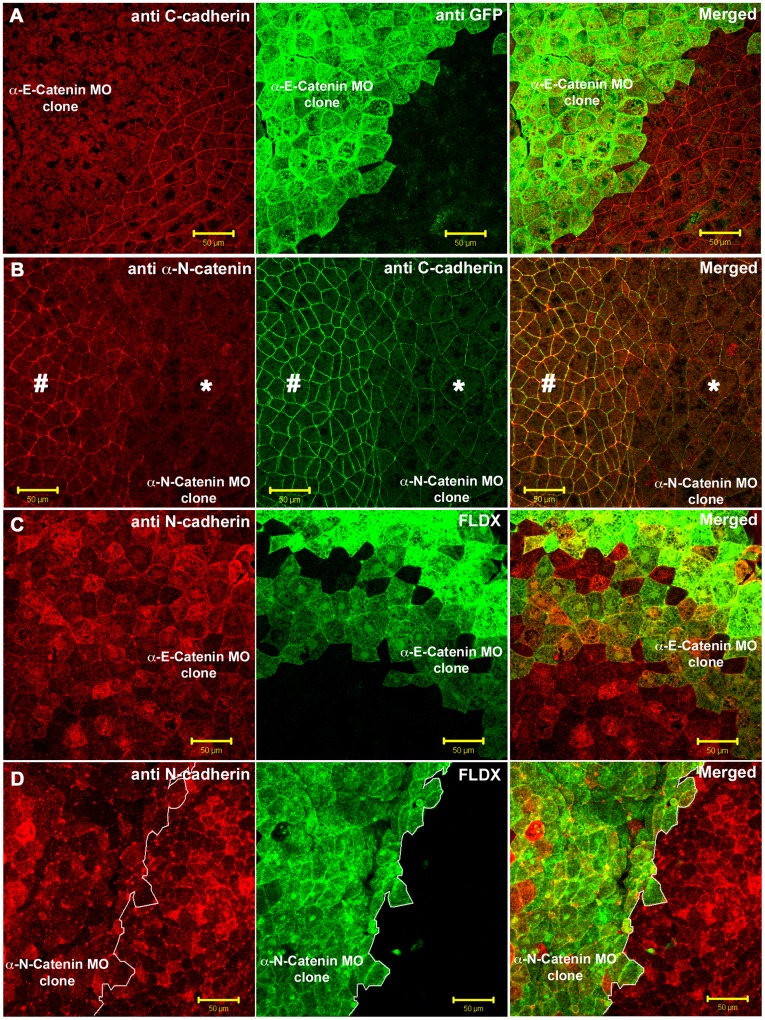
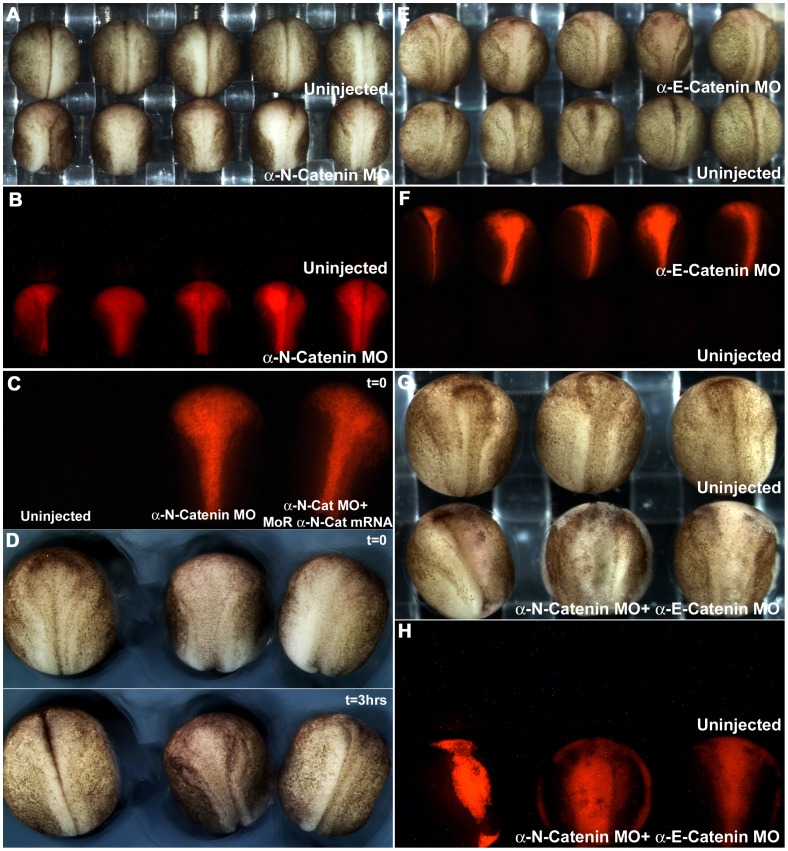
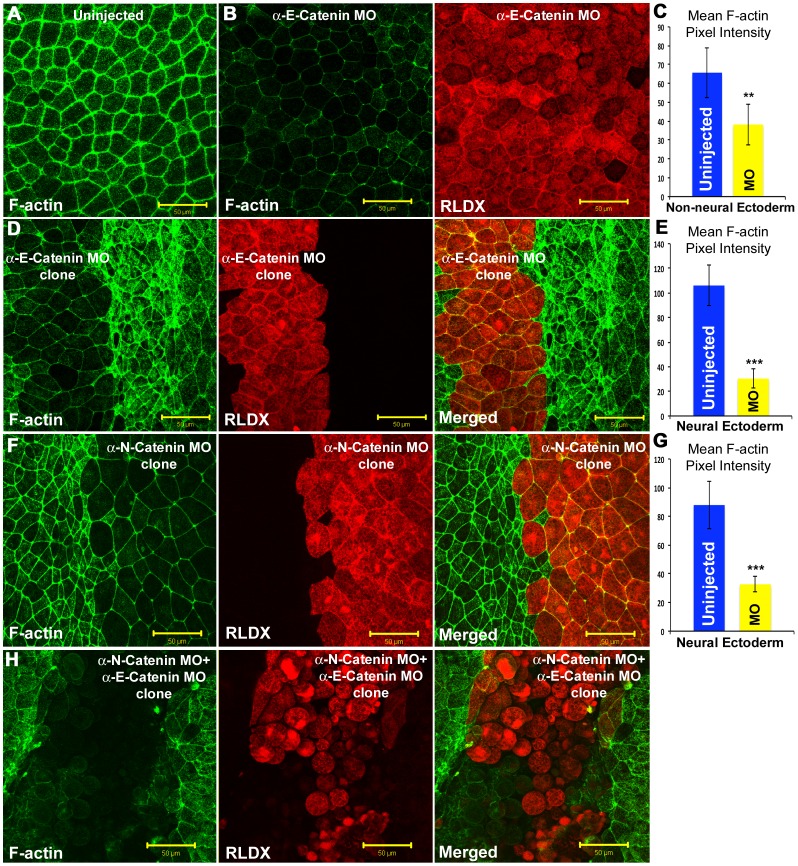
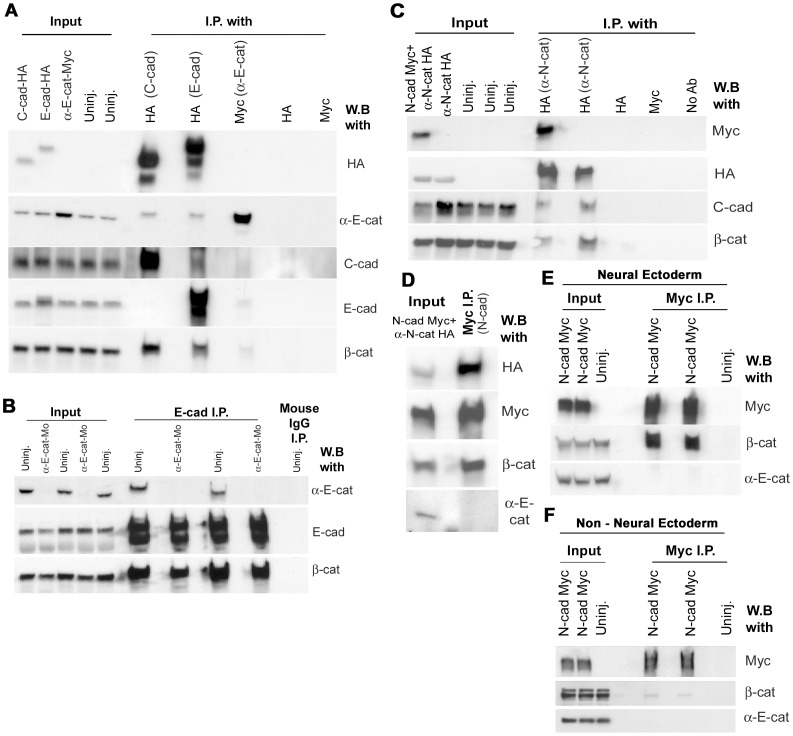
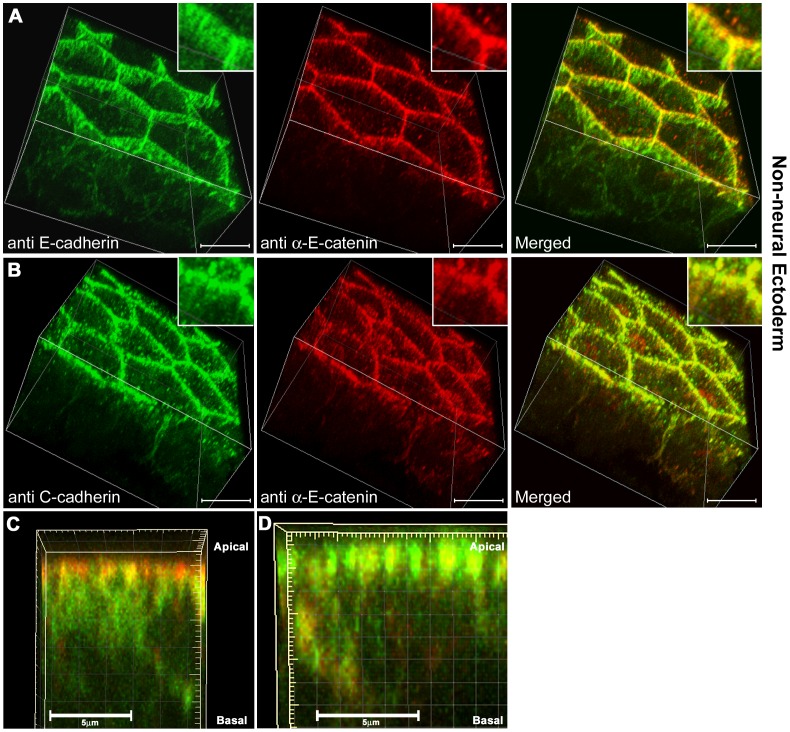
Alpha (α)-E-catenin is a component of the cadherin complex, and has long been thought to provide a link between cell surface cadherins and the actin skeleton. More recently, it has also been implicated in mechano-sensing, and in the control of tissue size. Here we use the early Xenopus embryos to explore functional differences between two α-catenin family members, α-E- and α-N-catenin, and their interactions with the different classical cadherins that appear as tissues of the embryo become segregated from each other. We show that they play both cadherin-specific and context-specific roles in the emerging tissues of the embryo. α-E-catenin interacts with both C- and E-cadherin. It is specifically required for junctional localization of C-cadherin, but not of E-cadherin or N-cadherin at the neurula stage. α-N-cadherin interacts only with, and is specifically required for junctional localization of, N-cadherin. In addition, α -E-catenin is essential for normal tissue size control in the non-neural ectoderm, but not in the neural ectoderm or the blastula. We also show context specificity in cadherin/ α-catenin interactions. E-cadherin requires α-E-catenin for junctional localization in some tissues, but not in others, during early development. These specific functional cadherin/alpha-catenin interactions may explain the basis of cadherin specificity of actin assembly and morphogenetic movements seen previously in the neural and non-neural ectoderm.


Conflict of interest statement

Competing Interests: The authors have declared that no competing interests exist.

Figures

Figure 1
Figure 1. The C-cadhering catenin binding domain (CBD) is required for cell adhesion . (A–D
) Immunostaining for C-cadherin (upper panels) and αEC (lower panels) in paraffin sections of stage 9 embryos, showing the non-rescue of cell adhesion in the absence of the CBD. (E–H) 3D projections of high magnification, and high resolution confocal images showing the localization of C-cadherin protein. Scale bars for A-D, 50 µM, E-H, 20 µM.
Figure 2
Figure 2. C-terminus of α-E-catenin is sufficient to drive cadherin membrane expression.
(A) Immunostaining for C-cadherin (upper panels) and E-cadherin extracellular domain (lower panels) in animal caps, showing the rescue of cell adhesion and the expression of nEαC in cell junctions. (B) Immunostaining for β-catenin showing the junctional localization of nEαC is not through β-catenin. Scale bars for A-B, 50 µM.
Figure 3
Figure 3. α-E-catenin is required for C-cadherin expression on the cell surface in the blastula.
(A) Immunostaining of animal caps stained for C-cadherin, showing that the loss of C-cadherin junctional localization caused by αEC depletion can be rescued by the expression of wild type αEC mRNA.(B) Quantification of cell junction-localized C-cadherin levels. (C) Immunostaining of animal caps stained for C-cadherin, showing that the loss of C-cadherin junctional localization caused by αEC depletion cannot be fully rescued by the injection of C-cadherin mRNA.(D) Wound healing assay of embryos in which the animal caps have been dissected out and healed for 1 hr in 1×MMR, showing the increased negative effect of both α-catenin depletion and C-cadherin over-expression. Scale bars in A, C 50 µM.
Figure 4
Figure 4. The distribution of α-N-catenin and α-E-catenin mRNAs in the neural and non-neural ectoderm.
(A-C) αNC In-situ staining of st.13–19 embryos (D-F) αEC In-situ staining of st.13–19 embryos. NE (Neural Ectoderm), n-NE (non-Neural Ectoderm).
Figure 5
Figure 5. Antisense morpholino mediated depletion of α-E-catenin in the non-Neural Ectoderm.
(A) Western blot showing the level of αEC, C-cadherin, and E-cadherin protein levels in uninjected and αEC-MO-injected embryos at st.9,11, and 19.(B-D) Confocal projections of the non-neural ectoderm of wild type (B) or αEC-depleted (C) st. 19 embryos, stained for C-cadherin (Red) and αEC (Green), and rescue of C-cadherin (Red) junctional localization by the introduction of Myc-tagged (green), human wild type αEC (D). (E) Quantification of pixel intensity for C-cadherin levels. (F) E-cadherin (Red) junctional localization in αEC-depleted cells (Green, GFP) in the non-neural ectoderm. (G-H) Cross sections of αEC-depleted (G), or uninjected (H) embryos, stained for E-cadherin (Red) and GFP (green). (I) Quantification of pixel intensity for E-cadherin levels. (J-K) Wholemount vibratome sections stained for E-cadherin in wildtype (J) or αEC-depleted (K) embryos. Scale bars in B-D, F, J-K 50 µM, G-H 100 µM.
Figure 6
Figure 6. Depletion of α-E-catenin and α-N-catenin in the neural ectoderm.
(A) Neural plates containing αEC-depleted clones (green) stained for C-cadherin (Red) and GFP (Green). (B) Neural plates containing αNC-depleted clones (morpholino-injected side marked by *, and uninjected side marked by # ), stained for αNC (Red) and C-cadherin (Green). (C) αEC-depleted neural plate cells (Green, FLDX) stained for N-cadherin (Red). (D) αNC-depleted neural plate cells (Green, FLDX) stained for N-cadherin (Red). Scale bars in A-D, 50 µM.
Figure 7
Figure 7. α-N-catenin is critical for the normal morphogenesis of the neural tube.
(A) Robust open neural plate phenotype observed in αNC morpholino-injected embryos. (B) RLDX fluorescent signal marking the descendents of αNC morpholino-injected cells of embryos shown in (A). (C) RLDX fluorescent signal marking the descendents of αNC morpholino and rescued mRNA-injected cells, for embryos shown in (D, first frame). (D) First and last frames of a timelapse movie taken at 5 minute intervals, showing the rescue of neurulation movements by sequentially injecting αNC mRNA into morpholino-injected cells. (E) Delay in neurulation movements observed in αEC-depleted neural plates. (F) RLDX fluorescent signal marking the descendents of αEC morpholino-injected cells of embryos shown in (E). (G) Embryos depleted of both αEC and αNC, showing cell dissociation in their neural plates. (H) RLDX fluorescent signal marking the descendents of αEC and αNC morpholino-injected cells for embryos shown in (G).
Figure 8
Figure 8. Cortical F-actin staining in alpha catenin-depleted neural and non-neural ectodermal cells.
(A) Alexa-488 phalloidin staining for F-actin (green) in uninjected non-neural ectoderm cells. (B) αEC morpholino-injected non-neural ectoderm cells (Red, RLDX) showing the loss of F-actin (green). (C) Mean F-actin pixel intensity quantitation in uninjected and αEC-depleted non-neural ectoderm cells. (D) F-actin staining (green) in αEC-depleted neural ectoderm cells (Red). (E) Mean F-actin pixel intensity quantitation in uninjected and αEC-depleted neural ectoderm cells. (F) F-actin staining (green) in αNC-depleted neural ectoderm cells (Red). (G) Mean F-actin pixel intensity quantitation in uninjected and αNC-depleted neural ectoderm cells. (H) Neural plates stained for F-actin (green) in αEC, and αNC-depleted neural ectoderm cells (red). Scale bars, 50 µM.
Figure 9
Figure 9. Co-Immunoprecipitations of cadherin-catenin complexes.
(A) Western blot data of immunoprecipitations of the C-, and E-, cadherin complexes, using HA-tagged C-, and E-, cadherin, and Myc-tagged α-E-catenin, expressed in the non-neural ectoderm. (B) Western blot data of duplicate E-cadherin immunoprecipitations on wild type or αEC-depleted embryos. (C) Western blot data of immunoprecipitating N-cadherin-Myc or αNC-HA expressed in the neural ectoderm. (D) Sequential immunoprecipitation of N-cadherin-Myc from the lystae of N-cadherin-Myc + αNC-HA mRNA-injected embryos from (C). (E) Replicate immunoprecipitations of N-cadherin-Myc in embryos expressing N-cadherin-Myc in their neural ectoderms. (F) Replicate immunoprecipitations of N-cadherin-Myc in embryos expressing N-cadherin-Myc in their non neural ectoderms.
Figure 10
Figure 10. Three-dimensional projections of high resolution confocal images of cleared non-neural ectodermal cells.
(A) E-cadherin (green) and αEC (red) staining in wholemount, cleared, non-neural ectoderm samples imaged at 100× in nyquist limit and using a 2× zoom. (B) C-cadherin (green) and αEC (red) staining.(C) Side view projection of a 3D image stack from a single cell-cell contact membrane, E-cadherin (green) and αEC (red). (D) Side view projection of a 3D image stack from a single cell-cell contact membrane, C-cadherin (green) and αEC (red). Scale bars in A-B, 15 µM, C-D, 5 µM.
Figure 11
Figure 11. E-cadherin requires α-E-catenin in the non-polarized blastocelic roof cells, but not in the polarized superficial animal cap cells for junctional localization and cell adhesion.
(A-C) Blastocelic roof cells of st. 9 animal caps stained for C-cadherin (red in A and B), or E-cadherin-HA (red in C), αEC (purple), and F-actin (green) in uninjected (A), αEC-depleted (B), or αEC + E-cadherin-HA mRNA injected (C) embryos. (D-E) Superficial cells imaged from the blastocelic cavity in animal caps where all the deeper cells have fallen off, stained for C-cadherin in (D), or E-cadherin (E), in αEC depleted (D), or αEC depleted + E-cadherin-HA mRNA-injected (E) embryos. (F) Western blot data showing the depletion of αEC protein and the expression of C-, and E-, cadherin protein levels in the experiment. Scale bars, 50 µM.

References

    1. Takeichi M, Hatta K, Nose A, Nagafuchi A. Identification of a gene family of cadherin cell adhesion molecules. Cell Differ Dev. 1988;25 - PubMed
    1. Hirano S, Nose A, Hatta K, Kawakami A, Takeichi M. Calcium-dependent cell-cell adhesion molecules (cadherins): subclass specificities and possible involvement of actin bundles. J Cell Biol. 1987;105:2501–2510. - PMC - PubMed
    1. Jamora C, Fuchs E. Intercellular adhesion, signalling and the cytoskeleton. Nat Cell Biol. 2002;4:E101–108. - PubMed
    1. Kovacs EM, Goodwin M, Ali RG, Paterson AD, Yap AS. Cadherin-directed actin assembly: E-cadherin physically associates with the Arp2/3 complex to direct actin assembly in nascent adhesive contacts. Curr Biol. 2002;12:379–382. - PubMed
    1. Vaezi A, Bauer C, Vasioukhin V, Fuchs E. Actin cable dynamics and Rho/Rock orchestrate a polarized cytoskeletal architecture in the early steps of assembling a stratified epithelium. Dev Cell. 2002;3:367–381. - PubMed

Publication types