

Quantification of retrograde axonal transport in the rat optic nerve by fluorogold spectrometry
- PMID: 22719956
- PMCID: PMC3377715
- DOI: 10.1371/journal.pone.0038820
Quantification of retrograde axonal transport in the rat optic nerve by fluorogold spectrometry
Abstract
Purpose: Disturbed axonal transport is an important pathogenic factor in many neurodegenerative diseases, such as glaucoma, an eye disease characterised by progressive atrophy of the optic nerve. Quantification of retrograde axonal transport in the optic nerve usually requires labour intensive histochemical techniques or expensive equipment for in vivo imaging. Here, we report on a robust alternative method using Fluorogold (FG) as tracer, which is spectrometrically quantified in retinal tissue lysate.
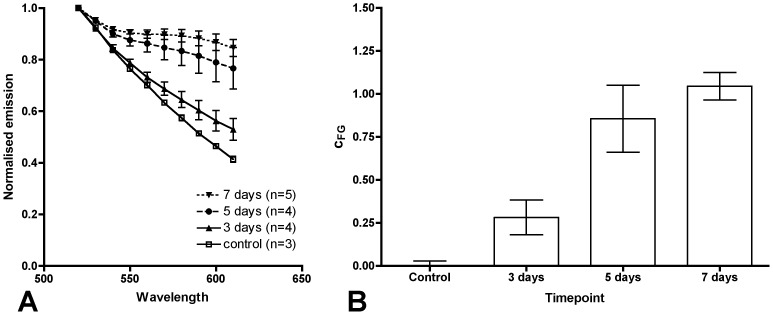
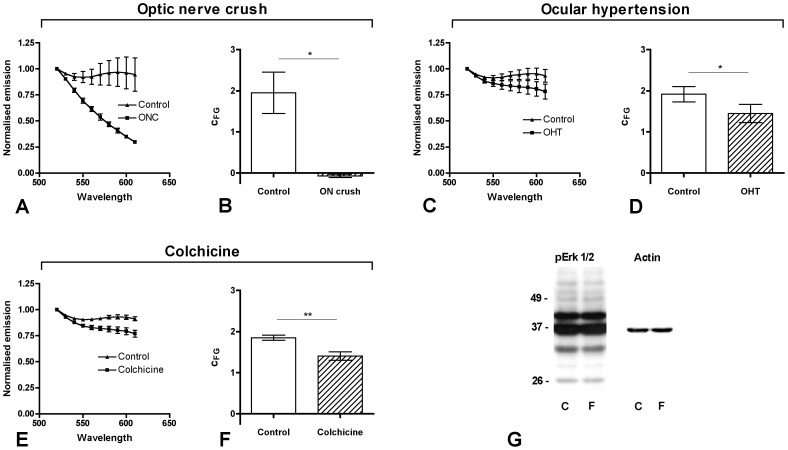
Methods: To determine parameters reflecting the relative FG content of a sample FG was dissolved in retinal lysates at different concentrations and spectra were obtained. For validation in vivo FG was injected uni- or bilaterally into the superior colliculus (SC) of Sprague Dawley rats. The retinal lysate was analysed after 3, 5 and 7 days to determine the time course of FG accumulation in the retina (n = 15). In subsequent experiments axona transport was impaired by optic nerve crush (n = 3), laser-induced ocular hypertension (n = 5) or colchicine treatment to the SC (n = 10).
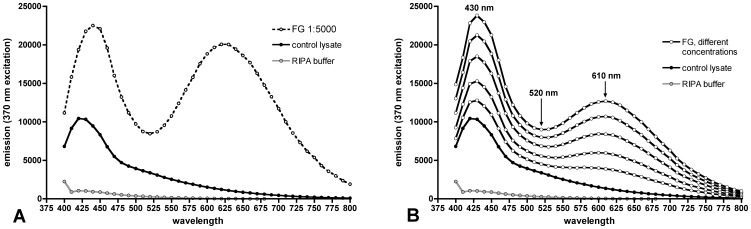
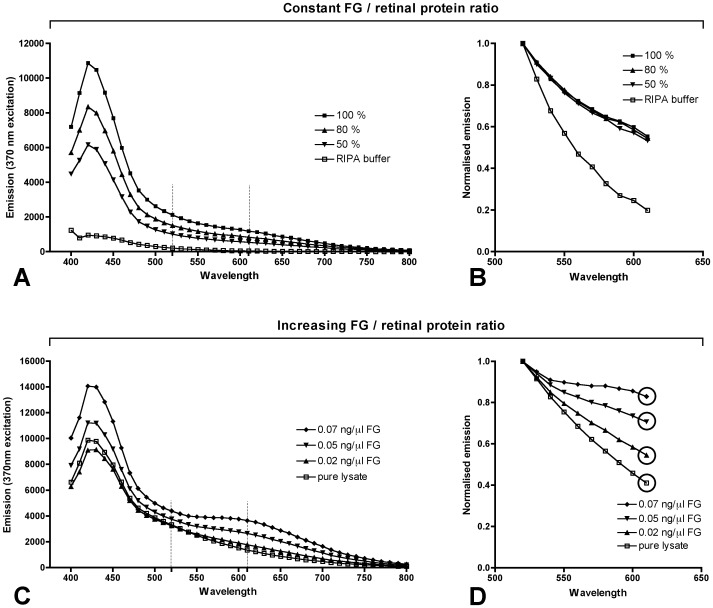
Results: Spectrometry at 370 nm excitation revealed two emission peaks at 430 and 610 nm. We devised a formula to calculate the relative FG content (c(FG)), from the emission spectrum. c(FG) is proportional to the real FG concentration as it corrects for variations of retinal protein concentration in the lysate. After SC injection, c(FG) monotonously increases with time (p = 0.002). Optic nerve axonal damage caused a significant decrease of c(FG) (crush p = 0.029; hypertension p = 0.025; colchicine p = 0.006). Lysates are amenable to subsequent protein analysis.
Conclusions: Spectrometrical FG detection in retinal lysates allows for quantitative assessment of retrograde axonal transport using standard laboratory equipment. It is faster than histochemical techniques and may also complement morphological in vivo analyses.
Conflict of interest statement
Figures
Similar articles
-
Ocular hypertension impairs optic nerve axonal transport leading to progressive retinal ganglion cell degeneration.Exp Eye Res. 2010 Jan;90(1):168-83. doi: 10.1016/j.exer.2009.10.003. Epub 2009 Oct 14. Exp Eye Res. 2010. PMID: 19835874
-
Intravitreal delivery of human NgR-Fc decoy protein regenerates axons after optic nerve crush and protects ganglion cells in glaucoma models.Invest Ophthalmol Vis Sci. 2015 Feb 5;56(2):1357-66. doi: 10.1167/iovs.14-15472. Invest Ophthalmol Vis Sci. 2015. PMID: 25655801 Free PMC article.
-
Acute endothelin-1 application induces reversible fast axonal transport blockade in adult rat optic nerve.Invest Ophthalmol Vis Sci. 2008 Mar;49(3):961-7. doi: 10.1167/iovs.07-1243. Invest Ophthalmol Vis Sci. 2008. PMID: 18326719
-
Assessment of retinal ganglion cell damage in glaucomatous optic neuropathy: Axon transport, injury and soma loss.Exp Eye Res. 2015 Dec;141:111-24. doi: 10.1016/j.exer.2015.06.006. Epub 2015 Jun 9. Exp Eye Res. 2015. PMID: 26070986 Review.
-
Autophagy in axonal degeneration in glaucomatous optic neuropathy.Prog Retin Eye Res. 2015 Jul;47:1-18. doi: 10.1016/j.preteyeres.2015.03.002. Epub 2015 Mar 26. Prog Retin Eye Res. 2015. PMID: 25816798 Review.
Cited by
-
Two-photon excitation fluorescent spectral and decay properties of retrograde neuronal tracer Fluoro-Gold.Sci Rep. 2021 Sep 10;11(1):18053. doi: 10.1038/s41598-021-97562-3. Sci Rep. 2021. PMID: 34508127 Free PMC article.
-
The Role of Axonal Transport in Glaucoma.Int J Mol Sci. 2022 Apr 1;23(7):3935. doi: 10.3390/ijms23073935. Int J Mol Sci. 2022. PMID: 35409291 Free PMC article. Review.
-
Astrocyte Reactivity: A Biomarker for Retinal Ganglion Cell Health in Retinal Neurodegeneration.J Clin Cell Immunol. 2014 Feb;5(1):188. doi: 10.4172/2155-9899.1000188. J Clin Cell Immunol. 2014. PMID: 25133067 Free PMC article.
References
-
- Hirokawa N, Niwa S, Tanaka Y. Molecular motors in neurons: transport mechanisms and roles in brain function, development, and disease. Neuron. 2010;68:610–638. - PubMed
-
- Levy JR, Holzbaur EL. Cytoplasmic dynein/dynactin function and dysfunction in motor neurons. Int J Dev Neurosci. 2006;24:103–111. - PubMed
-
- Salinas S, Bilsland LG, Schiavo G. Molecular landmarks along the axonal route: axonal transport in health and disease. Curr Opin Cell Biol. 2008;20:445–453. - PubMed
-
- Kapitein LC, Hoogenraad CC. Which way to go? Cytoskeletal organization and polarized transport in neurons. Mol Cell Neurosci. 2010;46:9–20. - PubMed
-
- Pease ME, McKinnon SJ, Quigley HA, Kerrigan-Baumrind LA, Zack DJ. Obstructed axonal transport of BDNF and its receptor TrkB in experimental glaucoma. Invest Ophthalmol Vis Sci. 2000;41:764–774. - PubMed
Publication types
MeSH terms
Substances
LinkOut - more resources
Full Text Sources
