

Establishment of LIF-dependent human iPS cells closely related to basic FGF-dependent authentic iPS cells
- PMID: 22720020
- PMCID: PMC3374774
- DOI: 10.1371/journal.pone.0039022
Establishment of LIF-dependent human iPS cells closely related to basic FGF-dependent authentic iPS cells
Abstract
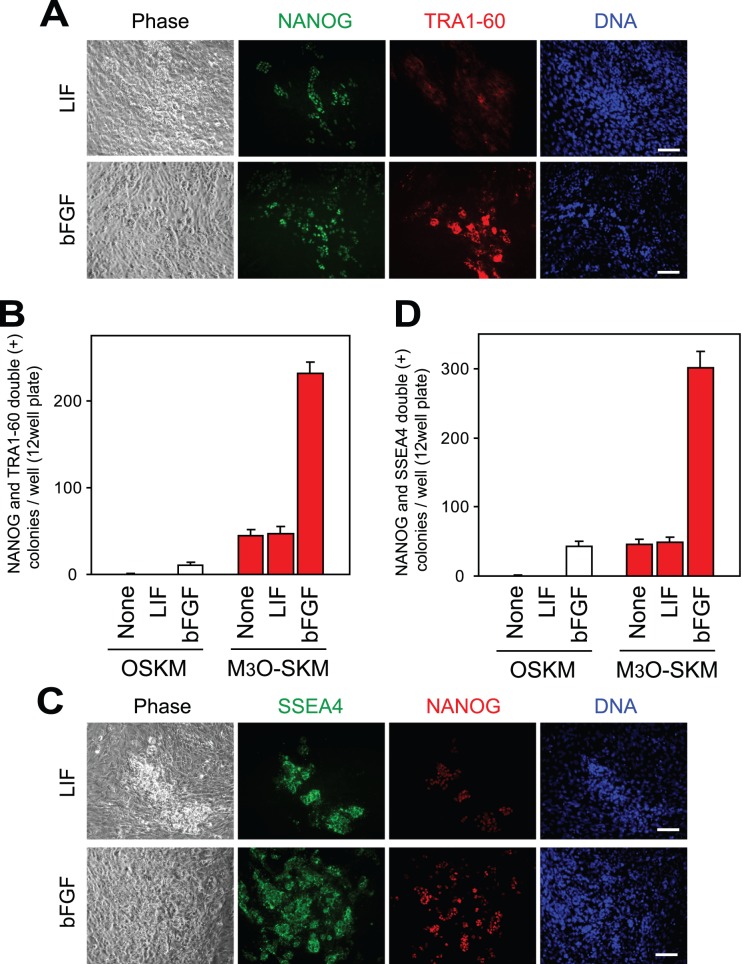
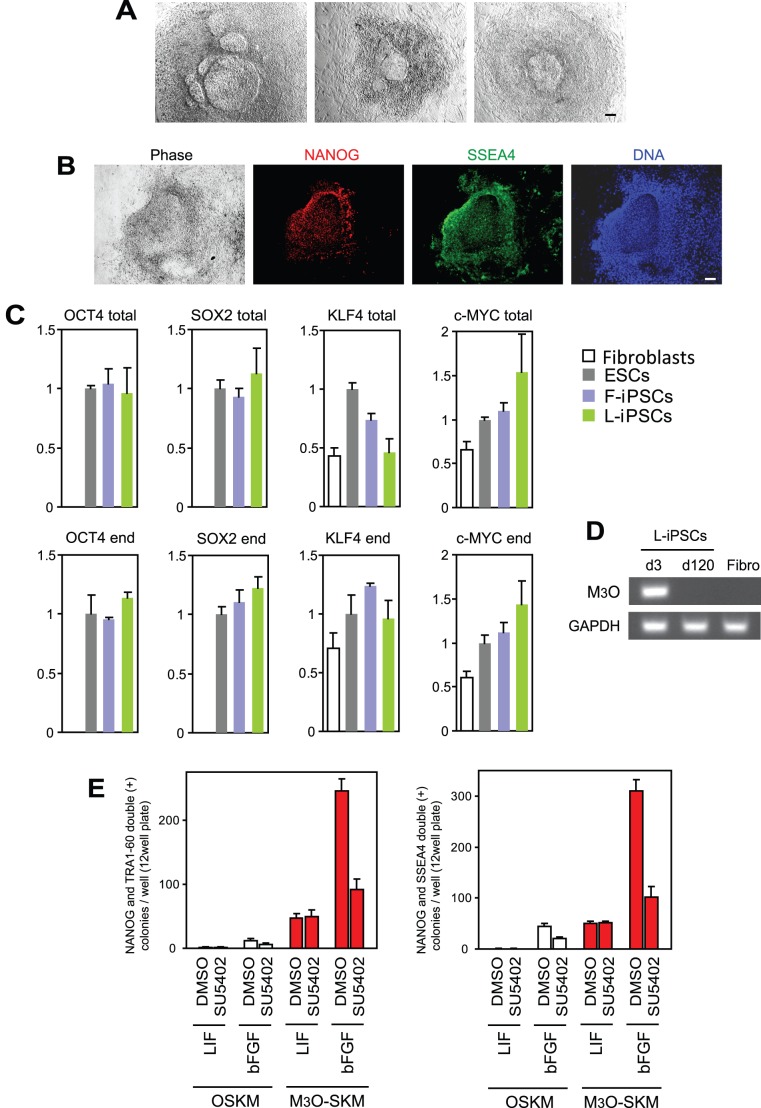
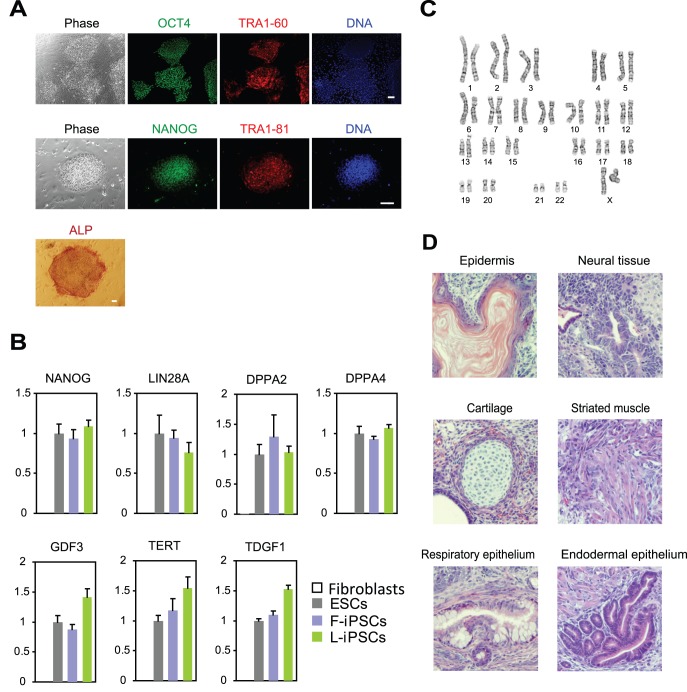
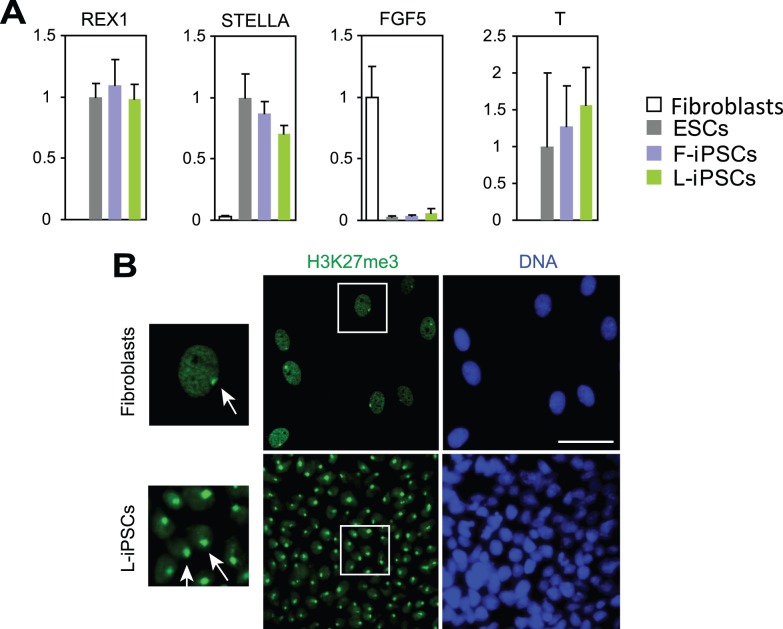
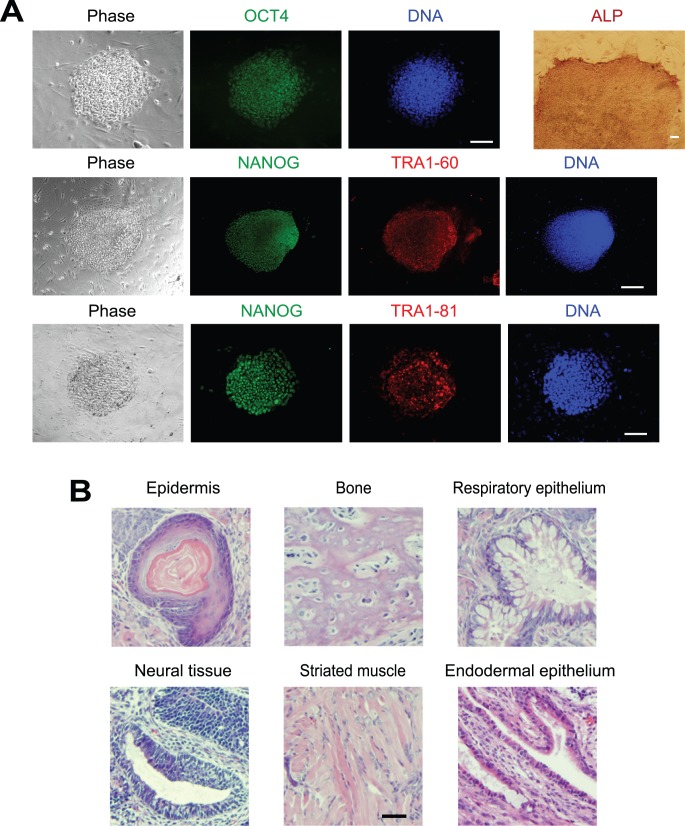
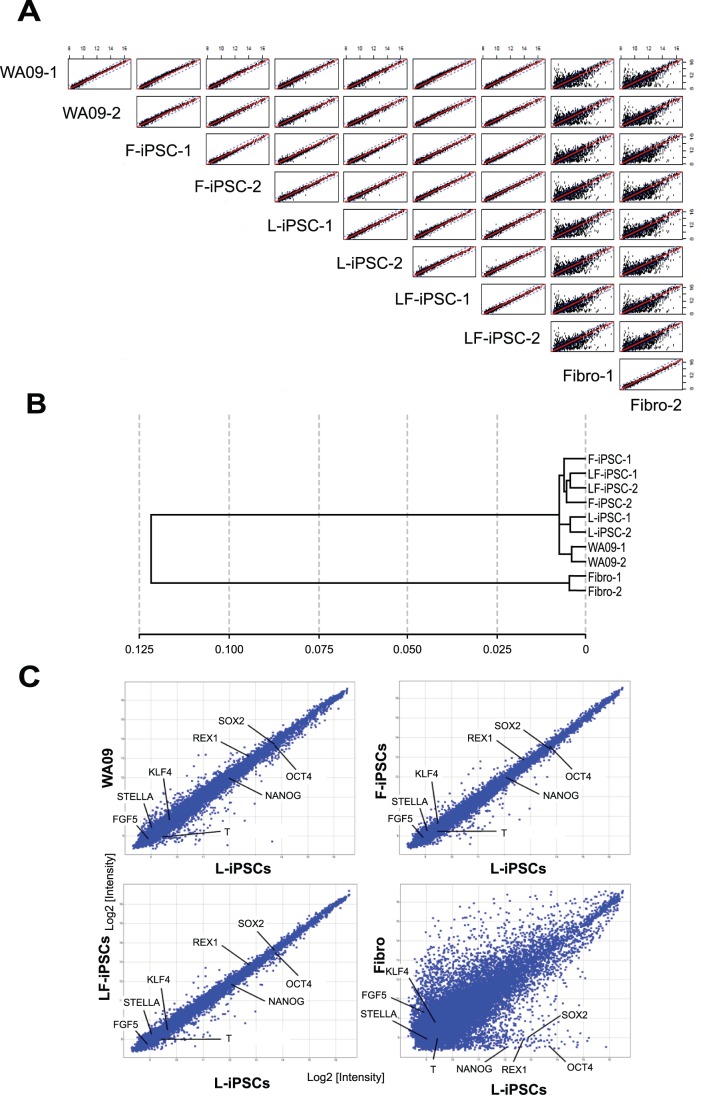
Human induced pluripotent stem cells (iPSCs) can be divided into a leukemia inhibitory factor (LIF)-dependent naïve type and a basic fibroblast growth factor (bFGF)-dependent primed type. Although the former are more undifferentiated than the latter, they require signal transduction inhibitors and sustained expression of the transgenes used for iPSC production. We used a transcriptionally enhanced version of OCT4 to establish LIF-dependent human iPSCs without the use of inhibitors and sustained transgene expression. These cells belong to the primed type of pluripotent stem cell, similar to bFGF-dependent iPSCs. Thus, the particular cytokine required for iPSC production does not necessarily define stem cell phenotypes as previously thought. It is likely that the bFGF and LIF signaling pathways converge on unidentified OCT4 target genes. These findings suggest that our LIF-dependent human iPSCs could provide a novel model to investigate the role of cytokine signaling in cellular reprogramming.
Conflict of interest statement
Figures
Similar articles
-
Establishment of leukemia inhibitory factor (LIF)-independent iPS cells with potentiated Oct4.Stem Cell Res. 2015 Nov;15(3):469-480. doi: 10.1016/j.scr.2015.09.002. Epub 2015 Sep 12. Stem Cell Res. 2015. PMID: 26413786 Free PMC article.
-
Positioning canine induced pluripotent stem cells (iPSCs) in the reprogramming landscape of naïve or primed state in comparison to mouse and human iPSCs.Life Sci. 2021 Jan 1;264:118701. doi: 10.1016/j.lfs.2020.118701. Epub 2020 Oct 30. Life Sci. 2021. PMID: 33130086
-
Germline-competent mouse-induced pluripotent stem cell lines generated on human fibroblasts without exogenous leukemia inhibitory factor.PLoS One. 2009 Aug 21;4(8):e6724. doi: 10.1371/journal.pone.0006724. PLoS One. 2009. PMID: 19696928 Free PMC article.
-
Signaling roadmap modulating naive and primed pluripotency.Stem Cells Dev. 2014 Feb 1;23(3):193-208. doi: 10.1089/scd.2013.0368. Epub 2013 Nov 27. Stem Cells Dev. 2014. PMID: 24147644 Review.
-
Regulation of embryonic stem cell self-renewal and pluripotency by leukaemia inhibitory factor.Biochem J. 2011 Aug 15;438(1):11-23. doi: 10.1042/BJ20102152. Biochem J. 2011. PMID: 21793804 Free PMC article. Review.
Cited by
-
Lineage-dependent effects of aryl hydrocarbon receptor agonists contribute to liver tumorigenesis.Hepatology. 2015 Feb;61(2):548-60. doi: 10.1002/hep.27547. Epub 2015 Jan 5. Hepatology. 2015. PMID: 25284723 Free PMC article.
-
Establishment of leukemia inhibitory factor (LIF)-independent iPS cells with potentiated Oct4.Stem Cell Res. 2015 Nov;15(3):469-480. doi: 10.1016/j.scr.2015.09.002. Epub 2015 Sep 12. Stem Cell Res. 2015. PMID: 26413786 Free PMC article.
-
Leukemia inhibitory factor regulates marmoset induced pluripotent stem cell proliferation via a PI3K/Akt‑dependent Tbx‑3 activation pathway.Int J Mol Med. 2018 Jul;42(1):131-140. doi: 10.3892/ijmm.2018.3610. Epub 2018 Apr 3. Int J Mol Med. 2018. PMID: 29620145 Free PMC article.
-
Reprogramming and transdifferentiation for cardiovascular development and regenerative medicine: where do we stand?EMBO Mol Med. 2015 Sep;7(9):1090-103. doi: 10.15252/emmm.201504395. EMBO Mol Med. 2015. PMID: 26183451 Free PMC article. Review.
-
Efficient reprogramming of naïve-like induced pluripotent stem cells from porcine adipose-derived stem cells with a feeder-independent and serum-free system.PLoS One. 2014 Jan 20;9(1):e85089. doi: 10.1371/journal.pone.0085089. eCollection 2014. PLoS One. 2014. PMID: 24465482 Free PMC article.
References
-
- Buecker C, Geijsen N. Different flavors of pluripotency, molecular mechanisms, and practical implications. Cell Stem Cell. 2010;7:559–564. - PubMed
-
- Kunath T. Primed for pluripotency. Cell Stem Cell. 2011;8:241–242. - PubMed
-
- Nichols J, Smith A. Naive and primed pluripotent states. Cell Stem Cell. 2009;4:487–492. - PubMed
Publication types
MeSH terms
Substances
Associated data
- Actions
Grants and funding
LinkOut - more resources
Full Text Sources
Other Literature Sources
Molecular Biology Databases
