. 2012;7(6):e39123.
doi: 10.1371/journal.pone.0039123. Epub 2012 Jun 15.

Temporal network based analysis of cell specific vein graft transcriptome defines key pathways and hub genes in implantation injury

Affiliations

Temporal network based analysis of cell specific vein graft transcriptome defines key pathways and hub genes in implantation injury

Manoj Bhasin et al. PLoS One. 2012.

Abstract

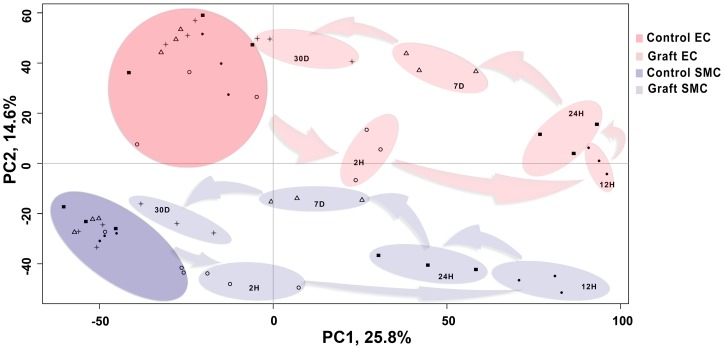
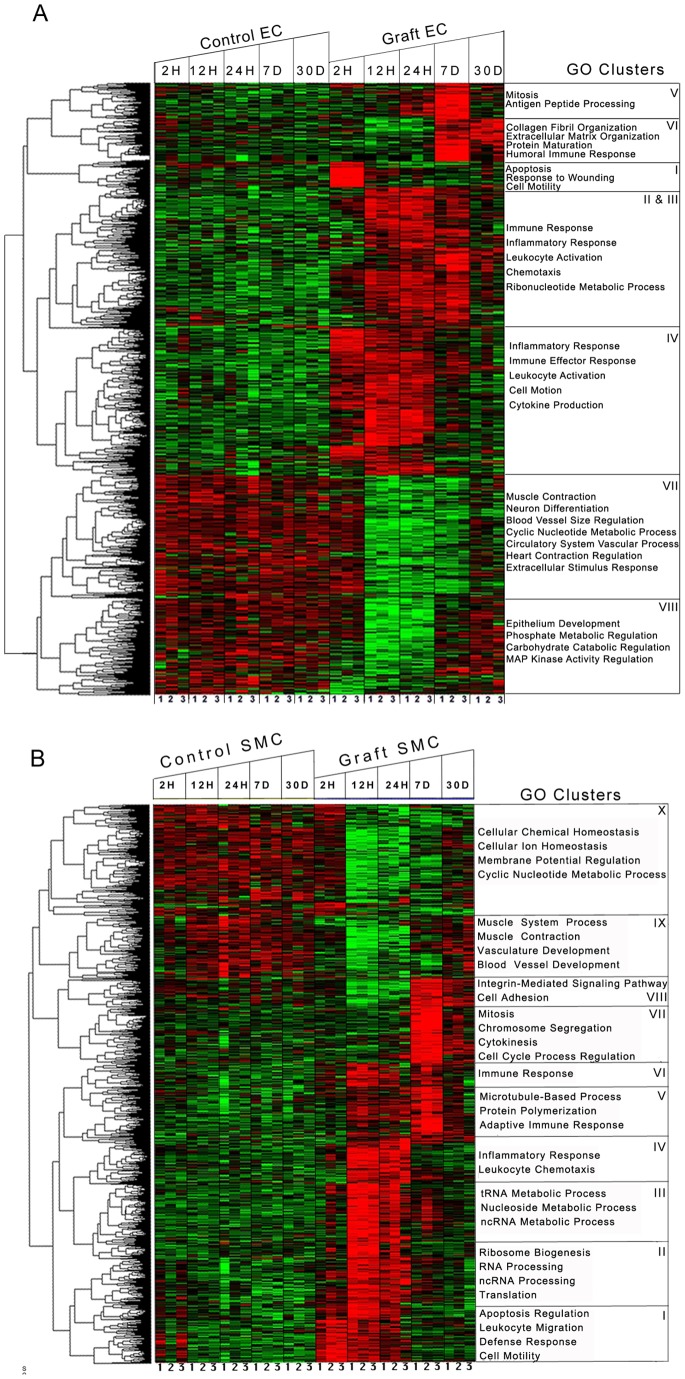
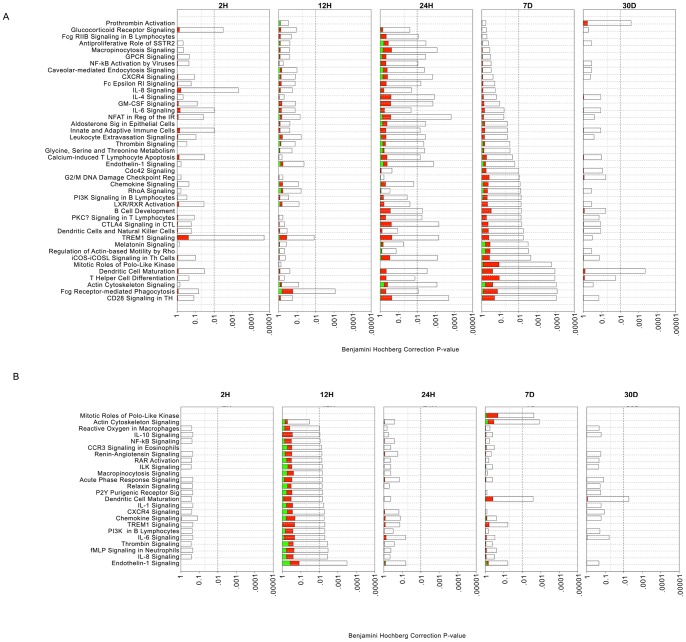
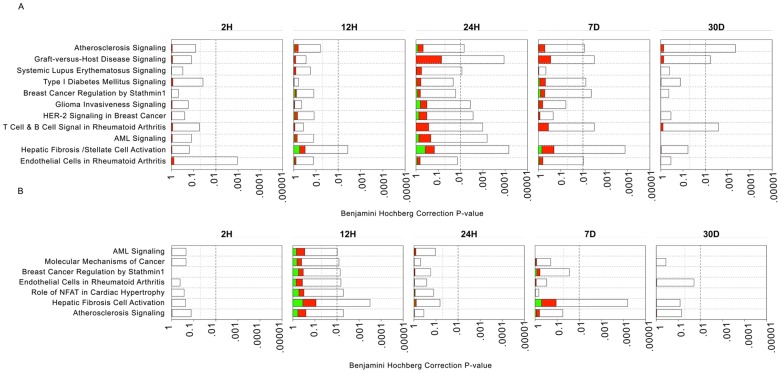
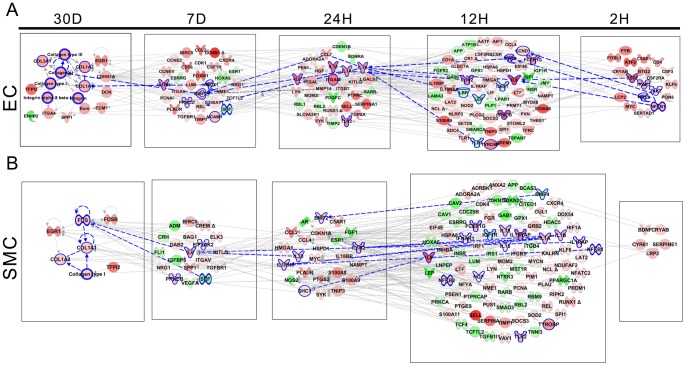
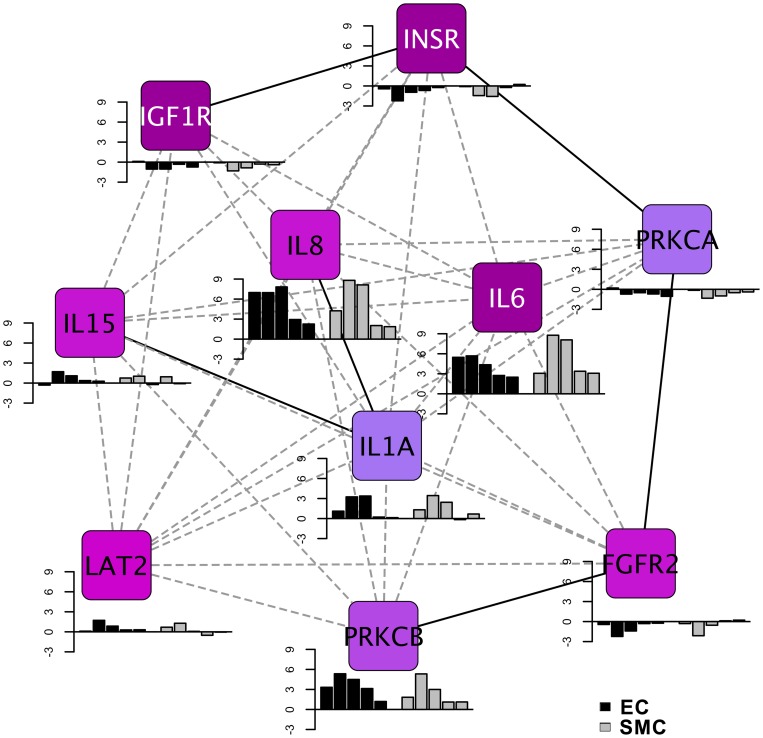
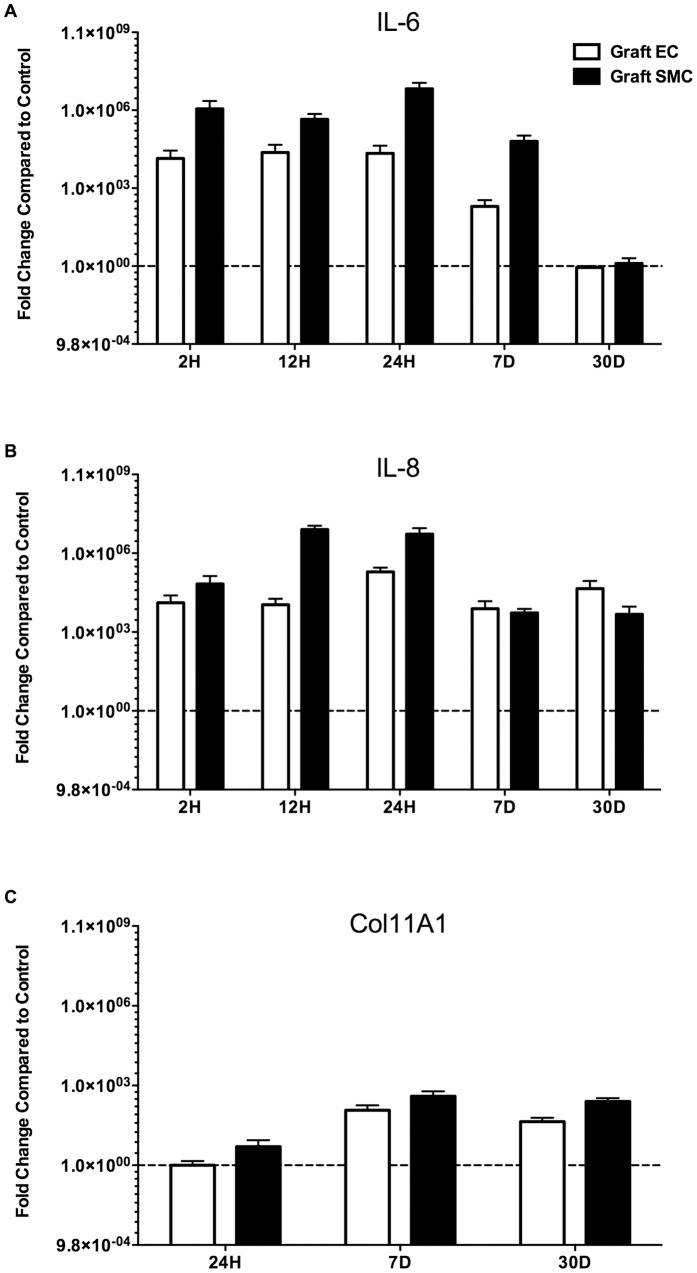
Vein graft failure occurs between 1 and 6 months after implantation due to obstructive intimal hyperplasia, related in part to implantation injury. The cell-specific and temporal response of the transcriptome to vein graft implantation injury was determined by transcriptional profiling of laser capture microdissected endothelial cells (EC) and medial smooth muscle cells (SMC) from canine vein grafts, 2 hours (H) to 30 days (D) following surgery. Our results demonstrate a robust genomic response beginning at 2 H, peaking at 12-24 H, declining by 7 D, and resolving by 30 D. Gene ontology and pathway analyses of differentially expressed genes indicated that implantation injury affects inflammatory and immune responses, apoptosis, mitosis, and extracellular matrix reorganization in both cell types. Through backpropagation an integrated network was built, starting with genes differentially expressed at 30 D, followed by adding upstream interactive genes from each prior time-point. This identified significant enrichment of IL-6, IL-8, NF-κB, dendritic cell maturation, glucocorticoid receptor, and Triggering Receptor Expressed on Myeloid Cells (TREM-1) signaling, as well as PPARα activation pathways in graft EC and SMC. Interactive network-based analyses identified IL-6, IL-8, IL-1α, and Insulin Receptor (INSR) as focus hub genes within these pathways. Real-time PCR was used for the validation of two of these genes: IL-6 and IL-8, in addition to Collagen 11A1 (COL11A1), a cornerstone of the backpropagation. In conclusion, these results establish causality relationships clarifying the pathogenesis of vein graft implantation injury, and identifying novel targets for its prevention.


Conflict of interest statement

Competing Interests: The authors have declared that no competing interests exist.

Figures

Figure 1
Figure 1. Principal Component Analysis(PCA) of the temporal expression data from control vein and vein graft.
The preprocessed transcriptional data from the control vein and vein graft endothelial cells (EC) as well as smooth muscle cells (SMC) is plotted along the top two components from the PCA. The first component with highest variance (25.8%) is shown on the X-axis and second highest (14.6%) is displayed on the Y-axis. On the basis of these components, the data can be differentiated in four major clusters i.e. control EC (dark red), control SMC (dark blue), graft EC (light red) and graft SMC (light blue). Each cluster further consists of sub-clusters representing time dependent segregation. Each time-point is represented with unique symbols (2 H =♦, 12 H=•, 24 H=▪, 7 D=Δ and 30 D=*). In the plot, the distance between the samples is proportional to correlation at the transcriptional profile level. For example, control and graft sample clusters from both EC and SMC have minimum correlation at 12 H (maximum distance) and maximum correlation at 30 D (minimum distance).
Figure 2
Figure 2. Time series analysis of differentially expressed genes following vein graft implantation. A) EC, B) SMC:
The columns represent samples and the rows represent genes. Gene expression is shown with a pseudocolor scale (−1 to 1) with red color denoting increase and green color denoting decrease in gene expression. The heatmaps depict the differential gene expression patterns of endothelial cells (EC) and smooth muscle cells (SMC) that are clustered using K means. The gene ontology categories enriched in each K means cluster are represented with heatmaps. The detailed patterns of gene expression are provided for EC and SMC in Figures S3A & S3B respectively.
Figure 3
Figure 3. Analysis of canonical pathways enrichment in vein grafts at different time-points.
A) EC, B) SMC: Each panel denotes the effect on canonical pathways at particular time-points after graft implantation. Each bar represents a pathway with significance of enrichment determined using the Benjamini-Hochberg hypothesis corrected p-value (shown on primary X-axis). The directionality of the genes in each pathway is depicted using a pseudocolor (red for up-regulated genes, green for down-regulated genes and clear for unmodified genes).
Figure 4
Figure 4. Analysis of disease-related pathways enrichment in vein grafts at different time-points. A
) EC, B) SMC: Each panel denotes the effect on disease pathways at particular time-points after graft implantation. Each bar represents a pathway with significance of enrichment determined using the Benjamini-Hochberg hypothesis corrected p-value (shown on primary X-axis). The directionality of the genes in each pathway is depicted using a pseudocolor (red for up-regulated genes, green for down-regulated genes and clear for unmodified genes).
Figure 5
Figure 5. Backpropagation based interactive network analysis of the genes.
A) EC, B) SMC: A hierarchical network of interactive genes was developed consisting of differentially expressed genes from 30 D to 2 H. First level of the network was developed from the genes that are significantly differentially expressed at the final time-point (30 D). Second level of the network was built using differentially expressed upstream interactive genes at the prior time-point (7 D). This process was repeated until we reached the starting time-point of 2 H.
Figure 6
Figure 6. Signature network of vein graft implantation injury.
The network represents top ten focal gene hubs identified using density of maximum neighborhood component (DMNC) from backpropagation interaction network. The pseudocolor scale from violet to blue represents the DMNC rank from 1–10. DMNC rank is a level of significance with smaller rank indicating increasing confidence of criticality for network functioning. The bar graphs represent fold change for each focal gene hub in EC and SMC. Fold change of temporal data (2, 12 and 24 H, and 7 and 30 D) of EC and SMC is depicted by black and grey colored bars respectively.
Figure 7
Figure 7. Confirmation of change in gene expression of A) IL-6, B) IL-8 and C) Col11A1.
A) Relative gene expression of IL-6 in graft EC and graft SMC compared to control EC and control SMC respectively at 2, 12 and 24 H, and 7 and 30 D, B) Relative gene expression of IL-8 in graft EC and graft SMC compared to control EC and control SMC respectively at 2, 12 and 24 H, and 7 and 30 D and C) Relative gene expression of Collagen11A1 (Col11A1) in graft EC and graft SMC compared to control EC and control SMC respectively at 24 H, and 7 and 30 D.

References

    1. Hall M DC, Williams S, Golosinskiy A, Schwartzman A. National Hospital Discharge Survey: 2007 Summary. US Department of Health and Human Services. 2010. - PubMed
    1. Nowygrod R, Egorova N, Greco G, Anderson P, Gelijns A, et al. Trends, complications, and mortality in peripheral vascular surgery. J Vasc Surg. 2006;43:205–216. - PubMed
    1. DHHS. Statistics on Hospital-Based Care in the United States, 2007. The Healthcare Cost and Utilization Project: Department of Health and Human Services, USA. 2010.
    1. Conte M. Molecular engineering of vein bypass grafts. J Vasc Surg. 2007;45:A74–81. - PubMed
    1. Belkin M, Whittemore AD. Rutherford RB, editor. Infrainguinal bypass. 2000. pp. 98–1018. editor. Vascular surgery 5th ed. Philadelphia: WB Saunders Co.

Publication types