

Local increase of arginase activity in lesions of patients with cutaneous leishmaniasis in Ethiopia
- PMID: 22720104
- PMCID: PMC3373636
- DOI: 10.1371/journal.pntd.0001684
Local increase of arginase activity in lesions of patients with cutaneous leishmaniasis in Ethiopia
Abstract
Background: Cutaneous leishmaniasis is a vector-borne disease that is in Ethiopia mainly caused by the parasite Leishmania aethiopica. This neglected tropical disease is common in rural areas and causes serious morbidity. Persistent nonhealing cutaneous leishmaniasis has been associated with poor T cell mediated responses; however, the underlying mechanisms are not well understood.
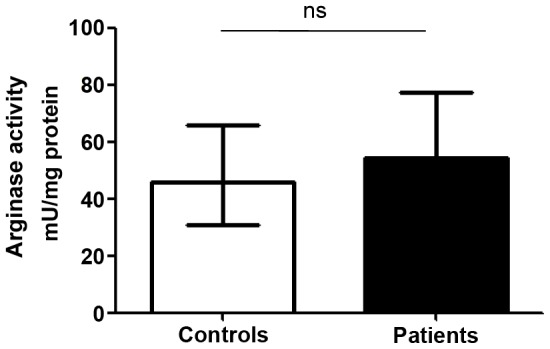
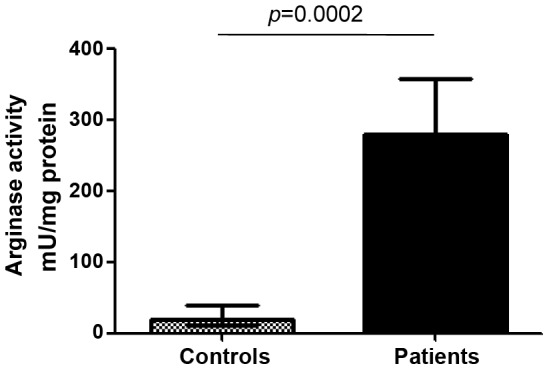
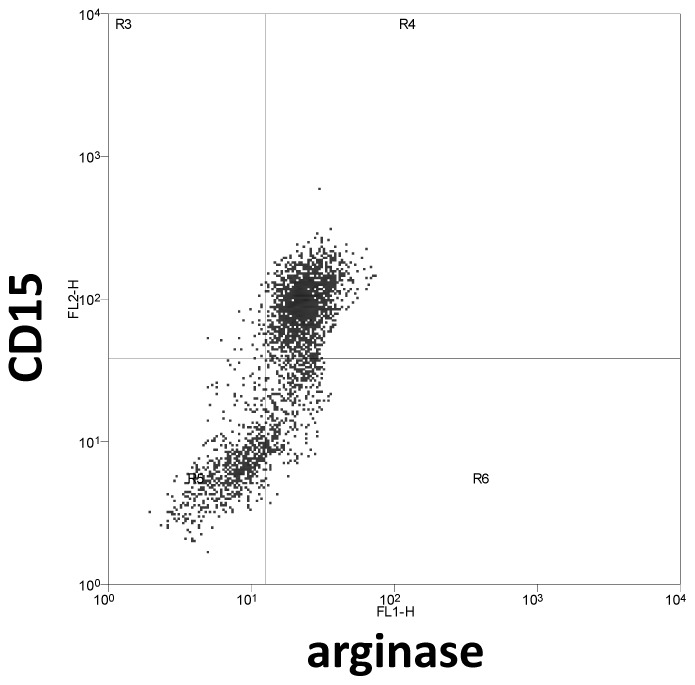
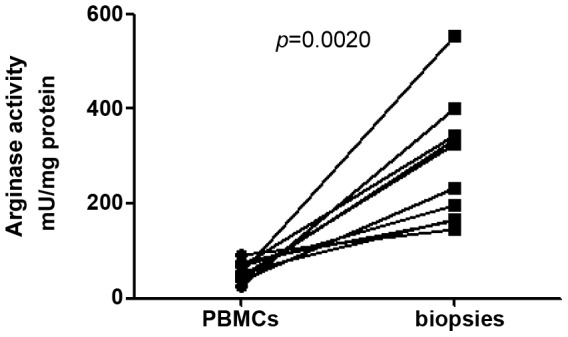
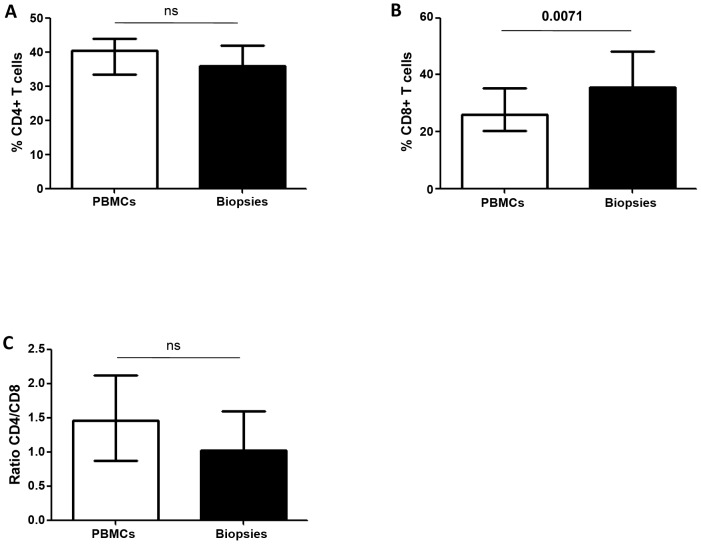
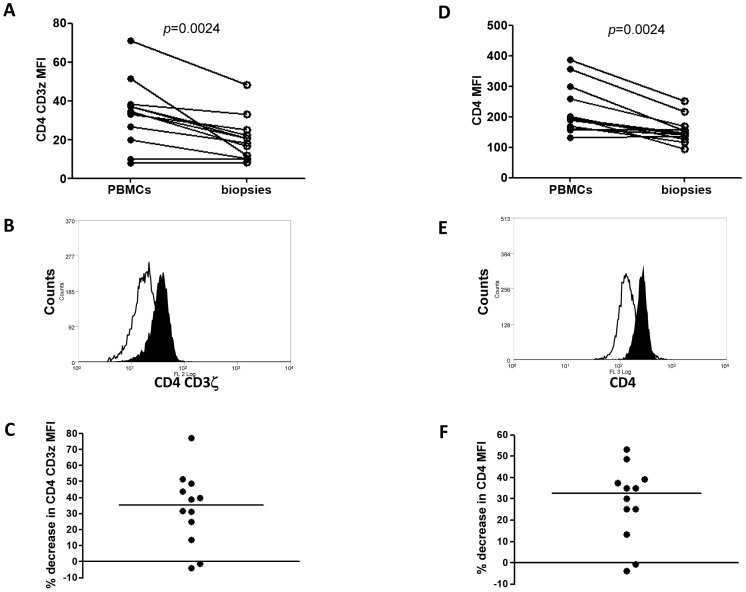
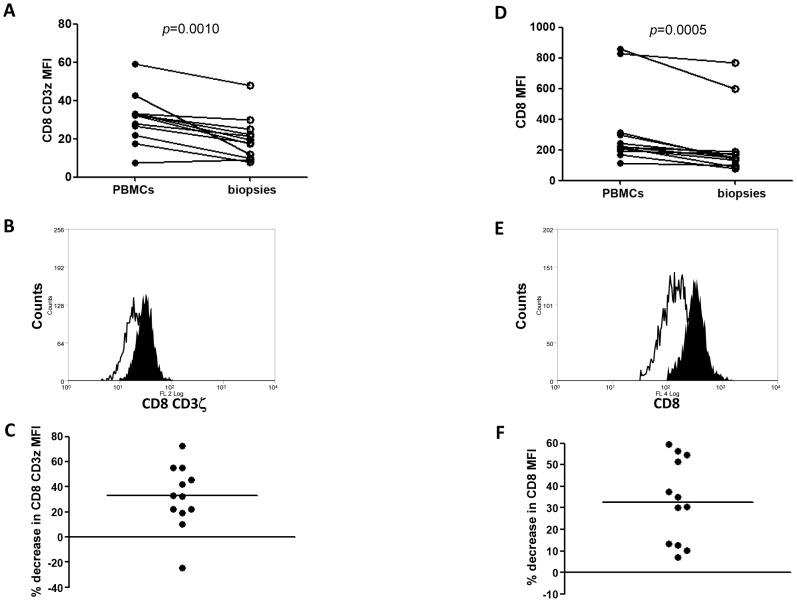
Methodology/principal findings: We have recently shown in an experimental model of cutaneous leishmaniasis that arginase-induced L-arginine metabolism suppresses antigen-specific T cell responses at the site of pathology, but not in the periphery. To test whether these results translate to human disease, we recruited patients presenting with localized lesions of cutaneous leishmaniasis and assessed the levels of arginase activity in cells isolated from peripheral blood and from skin biopsies. Arginase activity was similar in peripheral blood mononuclear cells (PBMCs) from patients and healthy controls. In sharp contrast, arginase activity was significantly increased in lesion biopsies of patients with localized cutaneous leishmaniasis as compared with controls. Furthermore, we found that the expression levels of CD3ζ, CD4 and CD8 molecules were considerably lower at the site of pathology as compared to those observed in paired PBMCs.
Conclusion: Our results suggest that increased arginase in lesions of patients with cutaneous leishmaniasis might play a role in the pathogenesis of the disease by impairing T cell effector functions.
Conflict of interest statement
The authors have declared that no competing interests exist.
Figures
Similar articles
-
Arginase activity - a marker of disease status in patients with visceral leishmaniasis in ethiopia.PLoS Negl Trop Dis. 2013;7(3):e2134. doi: 10.1371/journal.pntd.0002134. Epub 2013 Mar 28. PLoS Negl Trop Dis. 2013. PMID: 23556019 Free PMC article.
-
Age-related alteration of arginase activity impacts on severity of leishmaniasis.PLoS Negl Trop Dis. 2008 May 14;2(5):e235. doi: 10.1371/journal.pntd.0000235. PLoS Negl Trop Dis. 2008. PMID: 18478052 Free PMC article.
-
Comparing acute and chronic human cutaneous leishmaniasis caused by Leishmania major and Leishmania tropica focusing on arginase activity.J Eur Acad Dermatol Venereol. 2016 Dec;30(12):2118-2121. doi: 10.1111/jdv.13838. Epub 2016 Jul 21. J Eur Acad Dermatol Venereol. 2016. PMID: 27439742
-
Immunoregulatory mechanisms and CD4-CD8- (double negative) T cell subpopulations in human cutaneous leishmaniasis: a balancing act between protection and pathology.Int Immunopharmacol. 2008 Oct;8(10):1338-43. doi: 10.1016/j.intimp.2008.03.016. Int Immunopharmacol. 2008. PMID: 18687296 Free PMC article. Review.
-
Cutaneous Manifestations of Human and Murine Leishmaniasis.Int J Mol Sci. 2017 Jun 18;18(6):1296. doi: 10.3390/ijms18061296. Int J Mol Sci. 2017. PMID: 28629171 Free PMC article. Review.
Cited by
-
Efficacy of Four Solanum spp. Extracts in an Animal Model of Cutaneous Leishmaniasis.Medicines (Basel). 2018 Jun 5;5(2):49. doi: 10.3390/medicines5020049. Medicines (Basel). 2018. PMID: 29874837 Free PMC article.
-
Leptin regulates Granzyme-A, PD-1 and CTLA-4 expression in T cell to control visceral leishmaniasis in BALB/c Mice.Sci Rep. 2017 Nov 7;7(1):14664. doi: 10.1038/s41598-017-15288-7. Sci Rep. 2017. PMID: 29116252 Free PMC article.
-
Macrophage arginase-1 controls bacterial growth and pathology in hypoxic tuberculosis granulomas.Proc Natl Acad Sci U S A. 2014 Sep 23;111(38):E4024-32. doi: 10.1073/pnas.1408839111. Epub 2014 Sep 8. Proc Natl Acad Sci U S A. 2014. PMID: 25201986 Free PMC article.
-
HIF-1α is a key regulator in potentiating suppressor activity and limiting the microbicidal capacity of MDSC-like cells during visceral leishmaniasis.PLoS Pathog. 2017 Sep 11;13(9):e1006616. doi: 10.1371/journal.ppat.1006616. eCollection 2017 Sep. PLoS Pathog. 2017. PMID: 28892492 Free PMC article.
-
Arginase activity - a marker of disease status in patients with visceral leishmaniasis in ethiopia.PLoS Negl Trop Dis. 2013;7(3):e2134. doi: 10.1371/journal.pntd.0002134. Epub 2013 Mar 28. PLoS Negl Trop Dis. 2013. PMID: 23556019 Free PMC article.
References
-
- WHO. The World health report 2004. 2004. Available: http://www.who.int/whr/2004/en. Accessed 2012 May 7.
-
- WHO. Control of leishmaniasis. Report by the Secretariat. 2006. Available: https://apps.who.int/gb/ebwha/pdf_files/EB118/B118_4-en.pdf. Accessed 2012 May 7.
-
- WHO. Control of the leishmaniases. 2010. Available: http://whqlibdoc.who.int/trs/WHO_TRS_949_eng.pdf. Accessed 2012 May 7.
-
- Hailu A, Gramiccia M, Kager PA. Visceral leishmaniasis in Aba-Roba, south-western Ethiopia: prevalence and incidence of active and subclinical infections. Ann Trop Med Parasitol. 2009;103:659–670. - PubMed
-
- Morrone A, Pitidis A, Pajno MC, Dassoni F, Latini O, et al. Epidemiological and geographical aspects of leishmaniasis in Tigray, northern Ethiopia: a retrospective analysis of medical records, 2005–2008. Trans R Soc Trop Med Hyg. 2011;105:273–280. - PubMed
Publication types
MeSH terms
Substances
Grants and funding
LinkOut - more resources
Full Text Sources
Research Materials
