. 2012 Oct;47(4):417-26.
doi: 10.1165/rcmb.2012-0090OC. Epub 2012 Jun 21.

Pulmonary macrophage subpopulations in the induction and resolution of acute lung injury

Affiliations

Pulmonary macrophage subpopulations in the induction and resolution of acute lung injury

Laura K Johnston et al. Am J Respir Cell Mol Biol. 2012 Oct.

Abstract

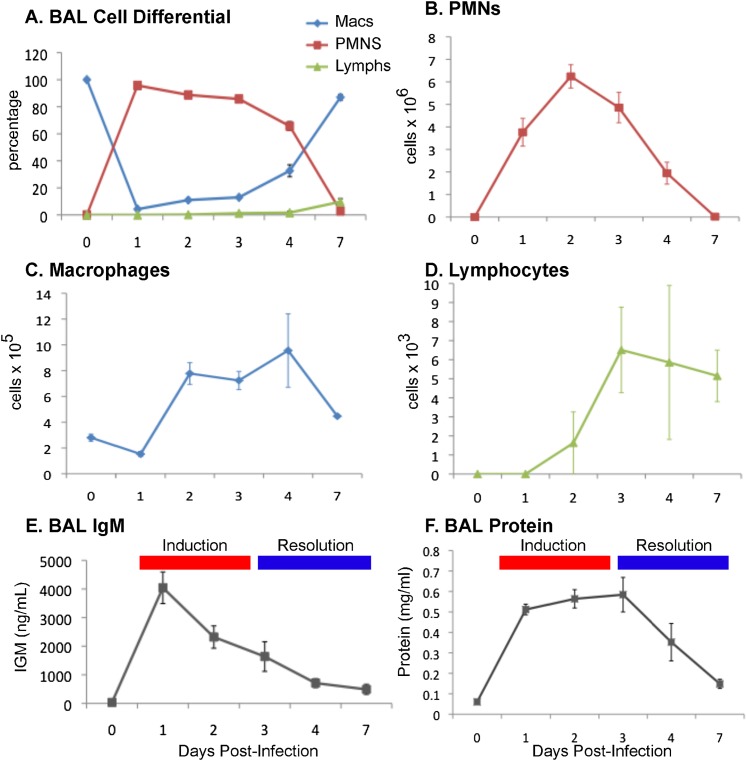
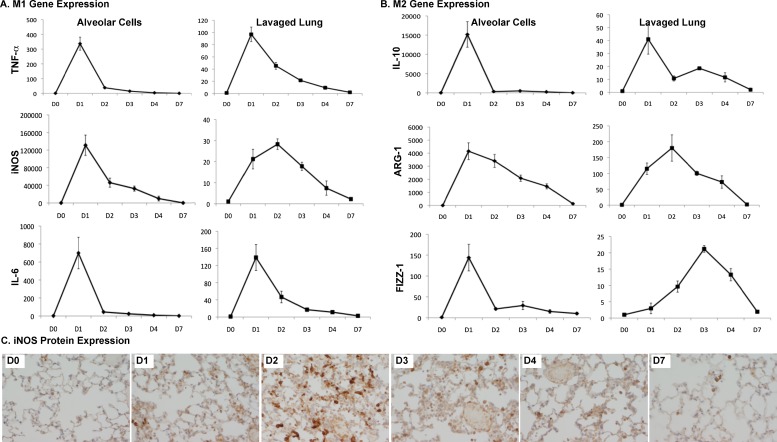
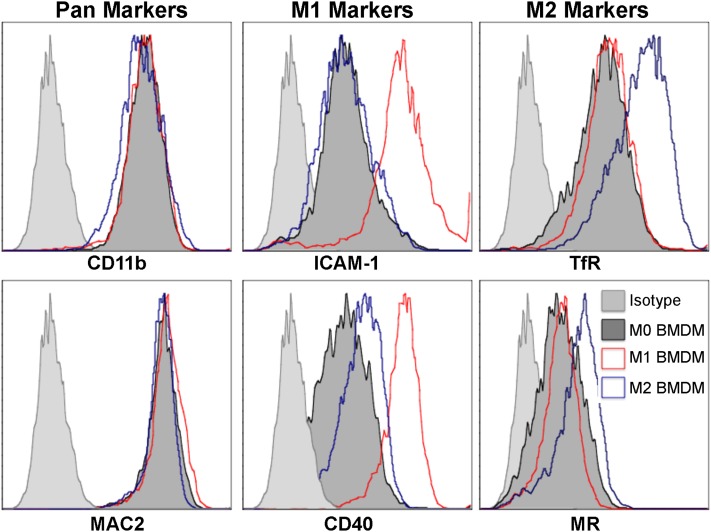
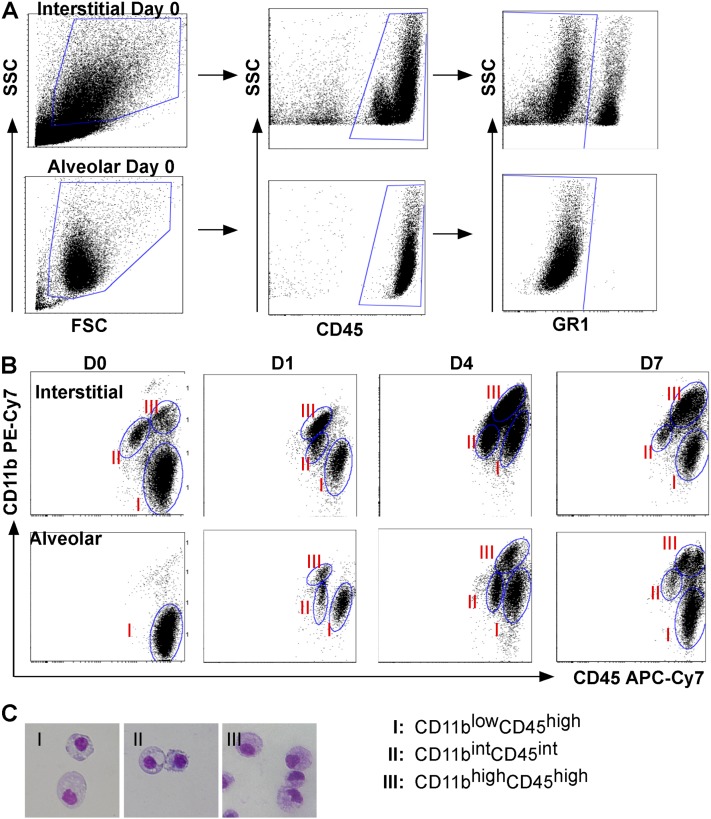
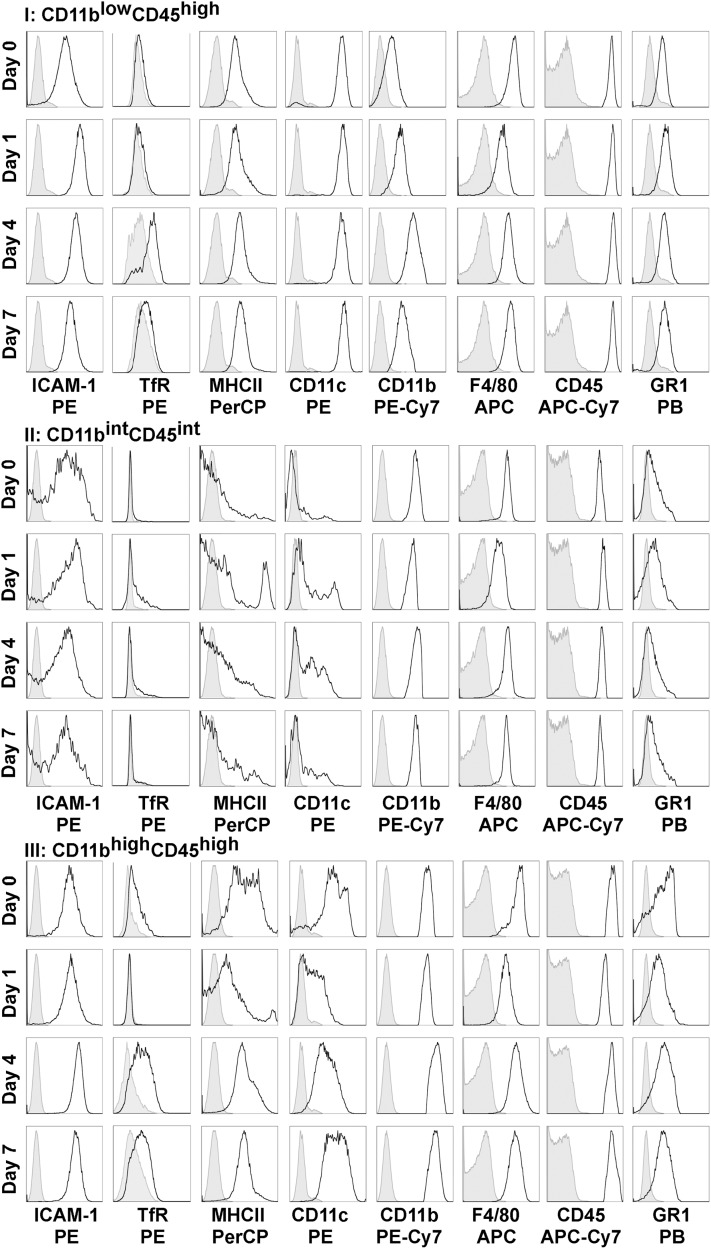
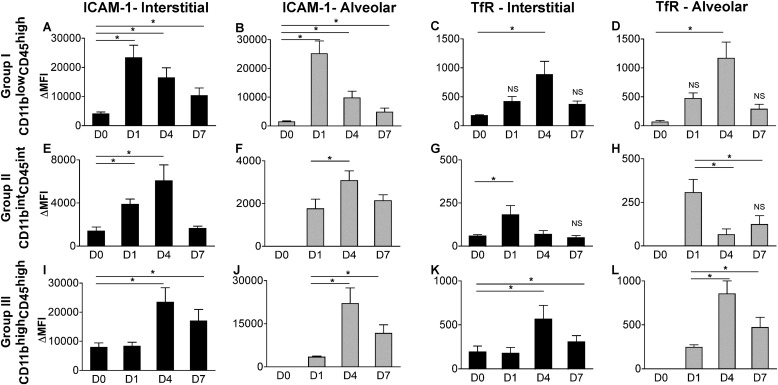
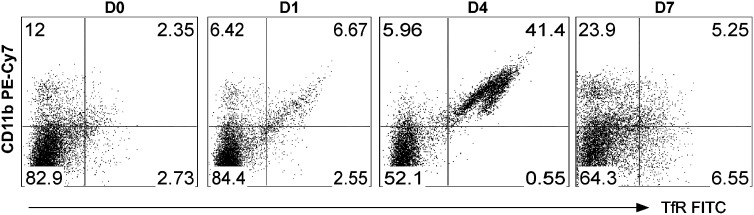
Macrophages are key orchestrators of the inflammatory and repair responses in the lung, and the diversity of their function is indicated by their polarized states and distinct subpopulations and localization in the lung. Here, we characterized the pulmonary macrophage populations in the interstitial and alveolar compartments during the induction and resolution of acute lung injury induced by Pseudomonas aeruginosa infection. We identified macrophage subpopulations and polarity according to FACS analysis of cell surface protein markers, combined with cell sorting for gene expression using real-time PCR. With these techniques, we validated a novel, alternatively activated (M2) marker (transferrin receptor), and we described three interstitial and alveolar macrophage subpopulations in the lung whose distribution and functional state evolved from the induction to resolution phases of lung injury. Together, these findings indicate the presence and evolution of distinct macrophage subsets in the lung that serve specific niches in regulating the inflammatory response and its resolution. Alterations in the balance and function of these subpopulations could lead to nonresolving acute lung injury.


Figures

Figure 1.
Figure 1.
Pulmonary inflammatory response in Pseudomonas aeruginosa pneumonia. Mice were infected with P. aeruginosa (1 × 10⁷ organisms) via oropharyngeal aspiration (n = 4 mice/time point). Bronchoalveolar lavage (BAL) fluid was collected, and samples were processed for cell counts and differentials on Days 1, 2, 3, 4, and 7. (A) BAL fluid cell differential was performed on 100 cells per sample, and as percentages of cells, neutrophils represented the majority of the cells from Days 1–4. The BAL fluid cell counts are reported for (B) neutrophils, (C) macrophages, and (D) lymphocytes, and both macrophages and lymphocytes increased in cell numbers from Days 2 to 4. (E) BAL fluid IgM concentration and (F) total protein, markers of vascular leakage, peaked early. Combined with the resolution of neutrophil counts, these parameters defined the induction and resolution phases of lung injury. PMNs, polymorphonuclear leukocytes.
Figure 2.
Figure 2.
Expression of classically activated (M1) and alternatively activated (M2) markers in alveolar and interstitial compartments. Mice (n = 3–4) were infected with P. aeruginosa and harvested on Days (D) 1–4 and 7. Lungs were lavaged for the collection of alveolar cells, and both alveolar cells and lavaged lungs were processed for RNA. RT-PCR, using commercially available primer–probe sets for M1 (TNF-α, inducible nitric oxide synthase [iNOS], and IL-6) and M2 (IL-10, arginase 1, and found in inflammatory zone 1) markers, was performed in duplicate on all samples and normalized to the housekeeping gene, hypoxanthine-guanine phosphoribosyl transferase. Results are reported as fold increase over Day 0 (uninfected) samples. All of the M1 markers peaked early (D1–D2), whereas the M2 markers demonstrated a bimodal distribution, especially apparent in the interstitial compartment. (C) iNOS protein expression in lung tissue matched that of its RNA expression, with a peak on Day 2.
Figure 3.
Figure 3.
Intracellular adhesion molecule 1 (ICAM-1) and transferrin receptor as markers of polarized macrophages. Bone marrow–derived macrophages (BMDM) were either untreated (M0; dark gray), stimulated with LPS for 24 hours (M1; red), or stimulated with IL-4/IL-13 for 48 hours (M2; blue). Cells were harvested and labeled with CD11b and MAC2 (pan-markers; left column); ICAM-1 and CD40 (M1 markers; middle column); and transferrin (TfR) and mannose receptor (MR) (M2 markers; right column). All pan, M1, and M2 markers were expressed by all groups, but only ICAM-1 and transferrin receptor increased selectively in M1 and M2 polarized cells, respectively. Transferrin receptor, as a marker of M2 cells, was more robust than that of mannose receptor. Isotype control samples are shown (light gray).
Figure 4.
Figure 4.
Identification of pulmonary macrophage subpopulations. (A) Subpopulation identification in interstitial (top row) and alveolar (bottom row) compartments on Day 0 was based on the following gating strategy: cells were selected according to their larger size (forward scatter [FSC]) and granularity (side scatter [SSC]) (left), on their CD45 expression to select leukocytes (middle), and on their granulocyte differentiation antigen 1 (GR-1)high exclusion to remove neutrophils (right). (B) Macrophages were grouped into three populations based on CD11b and CD45 staining intensity. Shown are representative dot plots from Days 0, 1, 4, and 7 after infection with P. aeruginosa, identifying Group I as CD11blowCD45high, Group II as CD11bintCD45int, and Group III as CD11bhighCD45high. (C) Representative cytospins of cells were sorted from Groups I–III, fixed, and stained with Diff-Quik. Cells demonstrated the appearance of macrophages, and Group III was comprised of cells with more of a kidney-shaped nucleus. APC-Cy7, allophycocyanin cyanine dye.
Figure 5.
Figure 5.
Cell-surface markers on pulmonary macrophage subpopulations from the interstitial compartment during the induction and resolution of acute lung injury (ALI). ICAM-1, TfR, major histocompatibility complex class II (MHCII), CD11c, CD11b, F4/80, CD45, and GR1 expression was determined according to macrophage subgroups (based on CD11b and CD45 gating) from the interstitial compartment on Days 0, 1, 4, and 7 after pneumonia. Group I (CD11blowCD45high) showed the greatest increase in ICAM-1 expression on Day 1, which decreased toward baseline during resolution (Days 4 and 7). These cells also expressed TfR during the resolution phase. Group II (CD11bintCD45int) cells expressed the M2 marker TfR on Day 1, and Group III (CD11bhighCD45high) cells expressed the M2 marker TfR during the resolution phase. APC, allophycocyanin; Cy7, cyanine; PB, Pacific blue; PE, R-phycoerythrin; PerCP, peridinin chlorphyll protein complex.
Figure 6.
Figure 6.
ICAM-1 and TfR identify polarized states of macrophage subpopulations during ALI. To identify changes in expression for ICAM-1 and TfR, we calculated the mean fluorescence intensity (MFI) for TfR, ICAM-1, and their respective isotype control samples. ΔMFI was calculated for each sample, and results are expressed as mean ΔMFI ± SEM for Group I (top row, A–D), Group II (middle row, EH), and Group III (bottom row, I–L). Group I macrophages in both compartments (solid bar, interstitial; gray bar, alveolar) showed the greatest increase in ICAM-1 expression during the induction phase of ALI, identifying M1 polarization in these resident cells. However, ICAM-1 was also highly expressed in recruited cells (Group III) during the resolution phase. TfR expression was significantly increased during the resolution phase in Groups I and III, peaking on Day 4, and on Day 1 in Group II. *P < 0.05, with Day 0 or Day 1 as reference group, as already noted (n = 6–9 samples per time point). The significance of the raw MFI for TfR and ICAM-1 compared with their respective isotype control samples was determined using the Student t test. Except where indicated as nonsignificant (NS), all findings were significant at P < 0.05.
Figure 7.
Figure 7.
Systemic polarized macrophage response during the resolution of ALI. Spleens were harvested on Days 0, 1, 4, and 7 after P. aeruginosa pneumonia, and cells were analyzed by flow cytometry using antibodies to F4/80, CD11b, GR1, MHCII, CD45, ICAM-1, and TfR. GR1high cells (neutrophils), CD45neg, and F4/80neg cells were excluded. The F4/80-positive macrophages were evaluated for CD11b and TfR expression, as shown. As seen in the lung, a striking increase in TfR-expressing CD11bhigh cells occurred on Day 4, with macrophage distribution returning toward baseline on Day 7.

Similar articles

Cited by

References

    1. Manicone A. Role of the pulmonary epithelium and inflammatory signals in acute lung injury. Expert Rev Clin Immunol 2009;5:63–75 - PMC - PubMed
    1. Aggarwal A, Baker CS, Evans TW, Haslam PL. G-CSF and IL-8 but not GM-CSF correlate with severity of pulmonary neutrophilia in acute respiratory distress syndrome. Eur Respir J 2000;15:895–901 - PubMed
    1. Belperio JA, Keane MP, Burdick MD, Londhe V, Xue YY, Li K, Phillips RJ, Strieter RM. Critical role for CXCR2 and CXCR2 ligands during the pathogenesis of ventilator-induced lung injury. J Clin Invest 2002;110:1703–1716 - PMC - PubMed
    1. Bhatia M, Brady M, Zagorski J, Christmas SE, Campbell F, Neoptolemos JP, Slavin J. Treatment with neutralising antibody against cytokine induced neutrophil chemoattractant (CINC) protects rats against acute pancreatitis associated lung injury. Gut 2000;47:838–844 - PMC - PubMed
    1. Kotani M, Kotani T, Ishizaka A, Fujishima S, Koh H, Tasaka S, Sawafuji M, Ikeda E, Moriyama K, Kotake Y, et al. Neutrophil depletion attenuates interleukin-8 production in mild-overstretch ventilated normal rabbit lung. Crit Care Med 2004;32:514–519 - PubMed

Publication types

MeSH terms