

Sequel of spontaneous seizures after kainic acid-induced status epilepticus and associated neuropathological changes in the subiculum and entorhinal cortex
- PMID: 22722023
- PMCID: PMC3409872
- DOI: 10.1016/j.neuropharm.2012.06.009
Sequel of spontaneous seizures after kainic acid-induced status epilepticus and associated neuropathological changes in the subiculum and entorhinal cortex
Abstract
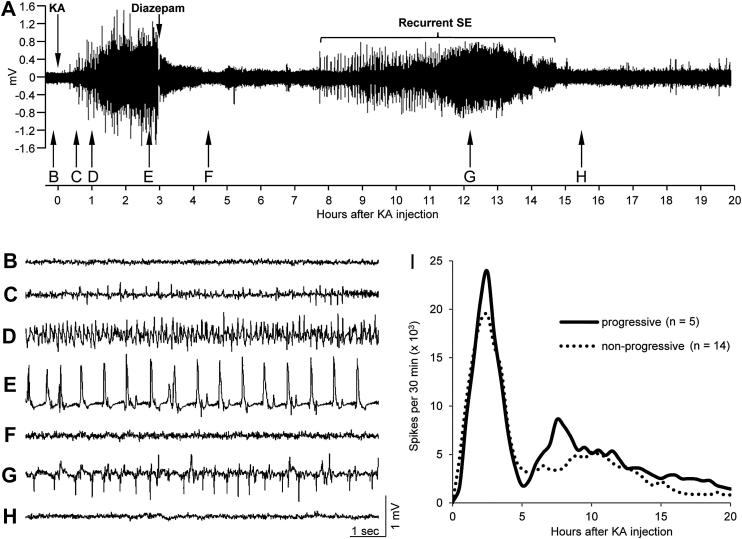
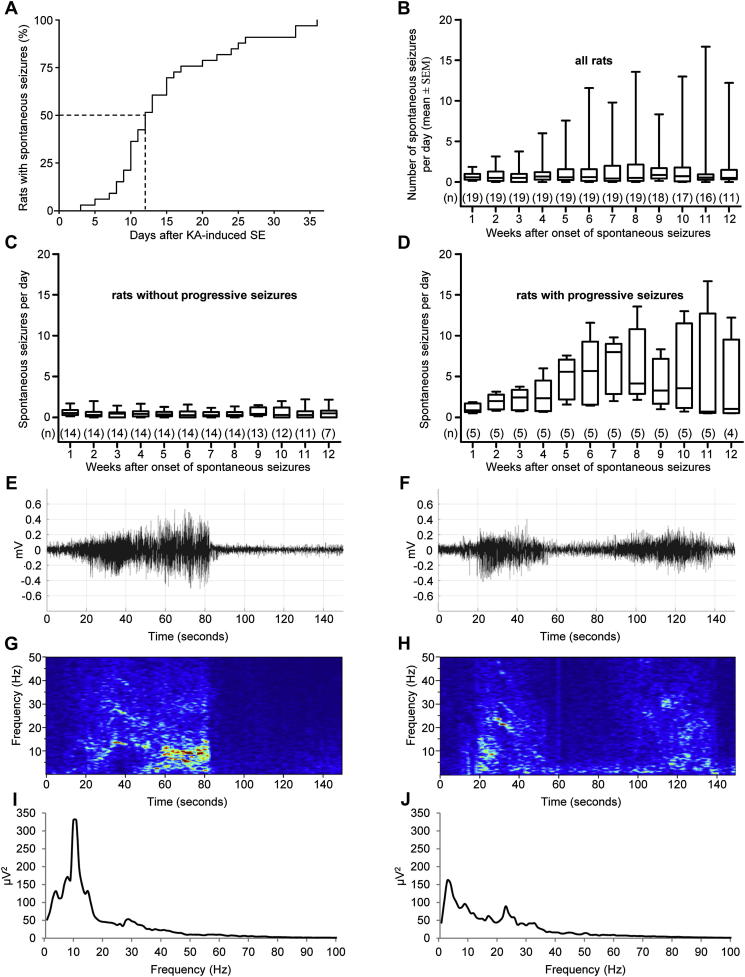
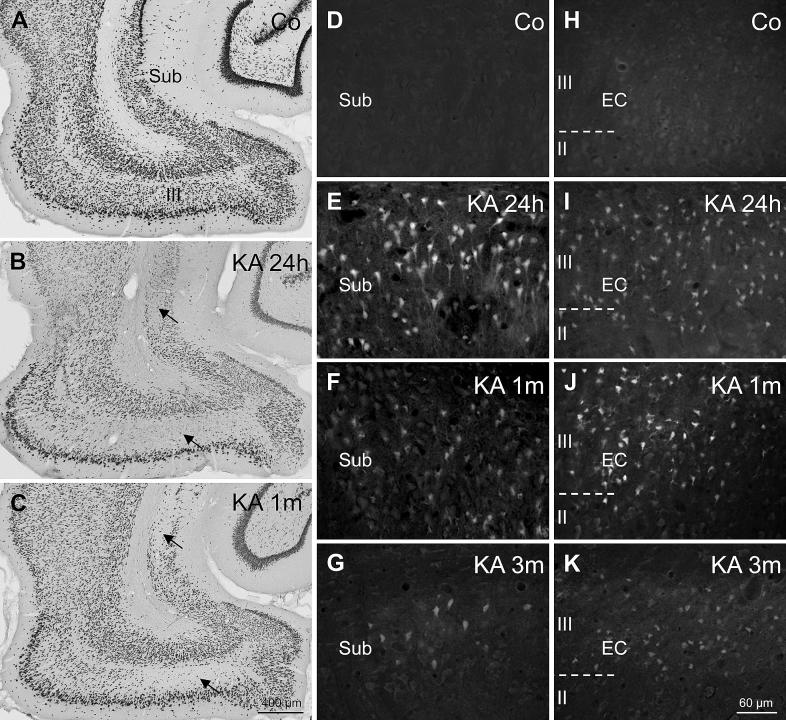
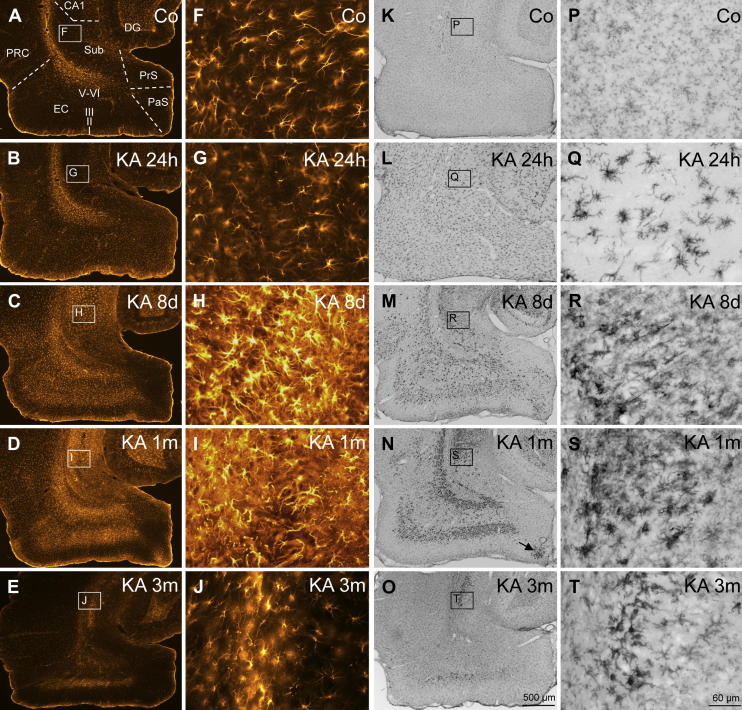
Injection of the seaweed toxin kainic acid (KA) in rats induces a severe status epilepticus initiating complex neuropathological changes in limbic brain areas and subsequently spontaneous recurrent seizures. Although neuropathological changes have been intensively investigated in the hippocampus proper and the dentate gyrus in various seizure models, much less is known about changes in parahippocampal areas. We now established telemetric EEG recordings combined with continuous video monitoring to characterize the development of spontaneous seizures after KA-induced status epilepticus, and investigated associated neurodegenerative changes, astrocyte and microglia proliferation in the subiculum and other parahippocampal brain areas. The onset of spontaneous seizures was heterogeneous, with an average latency of 15 ± 1.4 days (range 3-36 days) to the initial status epilepticus. The frequency of late spontaneous seizures was higher in rats in which the initial status epilepticus was recurrent after its interruption with diazepam compared to rats in which this treatment was more efficient. Seizure-induced neuropathological changes were assessed in the subiculum by losses in NeuN-positive neurons and by Fluoro-Jade C staining of degenerating neurons. Neuronal loss was already prominent 24 h after KA injection and only modestly progressed at the later intervals. It was most severe in the proximal subiculum and in layer III of the medial entorhinal cortex and distinct Fluoro-Jade C labeling was observed there in 75% of rats even after 3 months. Glutamatergic neurons, labeled by in situ hybridization for the vesicular glutamate transporter 1 followed a similar pattern of cell losses, except for the medial entorhinal cortex and the proximal subiculum that appeared more vulnerable. Glutamate decarboxylase65 (GAD65) mRNA expressing neurons were generally less vulnerable than glutamate neurons. Reactive astrocytes and microglia were present after 24 h, however, became prominent only after 8 days and remained high after 30 days. In the proximal subiculum, parasubiculum and entorhinal cortex the number of microglia cells was highest after 30 days. Although numbers of reactive astrocytes and microglia were reduced again after 3 months, they were still present in most rats. The time course of astrocyte and microglia proliferation parallels that of epileptogenesis.
Copyright © 2012 Elsevier Ltd. All rights reserved.
Figures
Similar articles
-
Parvalbumin interneurons and calretinin fibers arising from the thalamic nucleus reuniens degenerate in the subiculum after kainic acid-induced seizures.Neuroscience. 2011 Aug 25;189(1-2):316-29. doi: 10.1016/j.neuroscience.2011.05.021. Epub 2011 May 18. Neuroscience. 2011. PMID: 21616128 Free PMC article.
-
Changes in the expression of GABAA receptor subunit mRNAs in parahippocampal areas after kainic acid induced seizures.Front Neural Circuits. 2013 Sep 18;7:142. doi: 10.3389/fncir.2013.00142. eCollection 2013. Front Neural Circuits. 2013. PMID: 24065890 Free PMC article.
-
Neuronal degeneration is observed in multiple regions outside the hippocampus after lithium pilocarpine-induced status epilepticus in the immature rat.Neuroscience. 2013 Nov 12;252:45-59. doi: 10.1016/j.neuroscience.2013.07.045. Epub 2013 Jul 27. Neuroscience. 2013. PMID: 23896573 Free PMC article.
-
Relevance of seizure-induced neurogenesis in animal models of epilepsy to the etiology of temporal lobe epilepsy.Epilepsia. 2007;48 Suppl 2(Suppl 2):33-41. doi: 10.1111/j.1528-1167.2007.01065.x. Epilepsia. 2007. PMID: 17571351 Free PMC article. Review.
-
Defining "epileptogenesis" and identifying "antiepileptogenic targets" in animal models of acquired temporal lobe epilepsy is not as simple as it might seem.Neuropharmacology. 2013 Jun;69:3-15. doi: 10.1016/j.neuropharm.2012.01.022. Epub 2012 Feb 4. Neuropharmacology. 2013. PMID: 22342985 Free PMC article. Review.
Cited by
-
The piriform, perirhinal, and entorhinal cortex in seizure generation.Front Neural Circuits. 2015 May 29;9:27. doi: 10.3389/fncir.2015.00027. eCollection 2015. Front Neural Circuits. 2015. PMID: 26074779 Free PMC article. Review.
-
Phosphorylation of the HCN channel auxiliary subunit TRIP8b is altered in an animal model of temporal lobe epilepsy and modulates channel function.J Biol Chem. 2019 Oct 25;294(43):15743-15758. doi: 10.1074/jbc.RA119.010027. Epub 2019 Sep 5. J Biol Chem. 2019. PMID: 31492750 Free PMC article.
-
Expression of class II histone deacetylases in two mouse models of temporal lobe epilepsy.J Neurochem. 2016 Feb;136(4):717-730. doi: 10.1111/jnc.13440. Epub 2015 Dec 28. J Neurochem. 2016. PMID: 26603269 Free PMC article.
-
Kainic Acid-Induced Post-Status Epilepticus Models of Temporal Lobe Epilepsy with Diverging Seizure Phenotype and Neuropathology.Front Neurol. 2017 Nov 6;8:588. doi: 10.3389/fneur.2017.00588. eCollection 2017. Front Neurol. 2017. PMID: 29163349 Free PMC article.
-
Delta oscillation underlies the interictal spike changes after repeated transcranial direct current stimulation in a rat model of chronic seizures.Brain Stimul. 2021 Jul-Aug;14(4):771-779. doi: 10.1016/j.brs.2021.04.025. Epub 2021 May 11. Brain Stimul. 2021. PMID: 33989818 Free PMC article.
References
-
- Akassoglou K., Probert L., Kontogeorgos G., Kollias G. Astrocyte-specific but not neuron-specific transmembrane TNF triggers inflammation and degeneration in the central nervous system of transgenic mice. J. Immunol. 1997;158:438–445. - PubMed
-
- Ben-Ari Y., Tremblay E., Ottersen O.P., Naquet R. Evidence suggesting secondary epileptogenic lesion after kainic acid: pre treatment with diazepam reduces distant but not local brain damage. Brain Res. 1979;165:362–365. - PubMed
-
- Ben-Ari Y., Tremblay E., Ottersen O.P., Meldrum B.S. The role of epileptic activity in hippocampal and “remote” cerebral lesions induced by kainic acid. Brain Res. 1980;191:79–97. - PubMed
Publication types
MeSH terms
Substances
Grants and funding
LinkOut - more resources
Full Text Sources
Other Literature Sources
