Comparative Study
. 2012 Jun 28;486(7404):527-31.
doi: 10.1038/nature11128.

The bonobo genome compared with the chimpanzee and human genomes

Affiliations
Comparative Study

The bonobo genome compared with the chimpanzee and human genomes

Kay Prüfer et al. Nature. .

Abstract

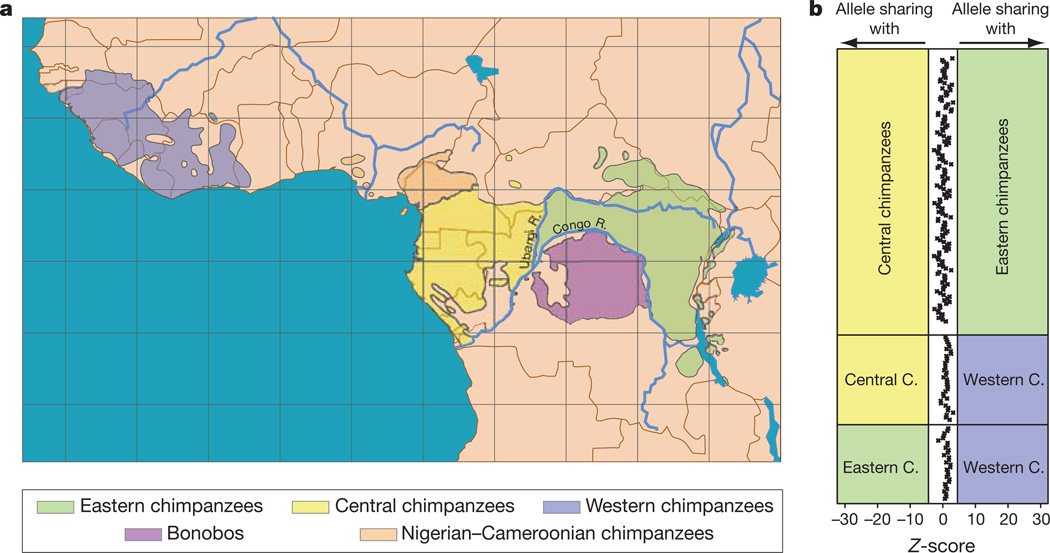
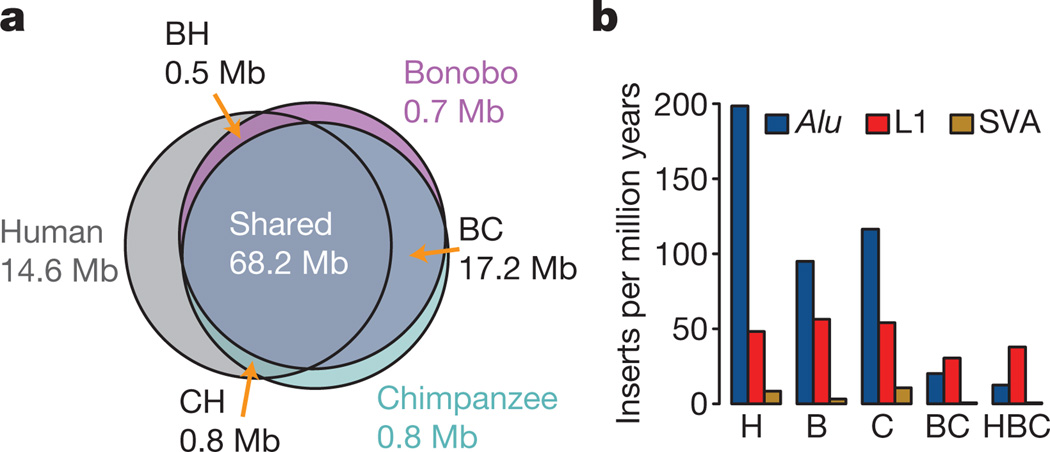
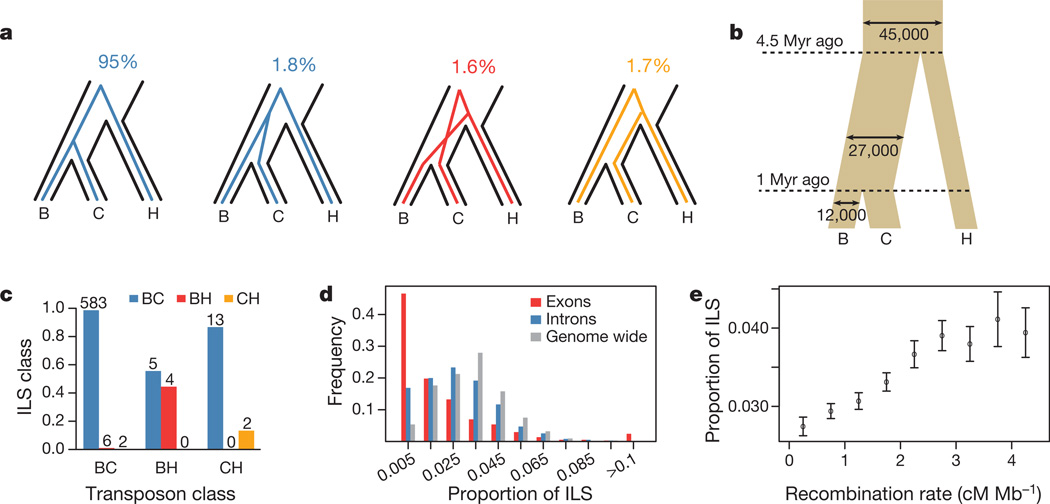
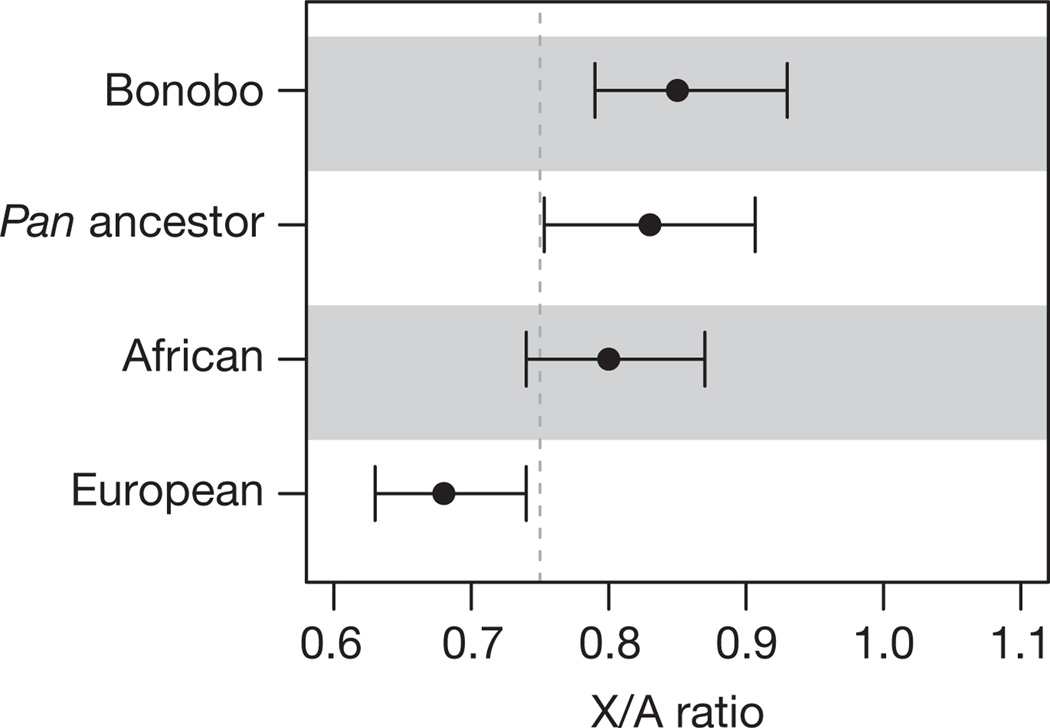
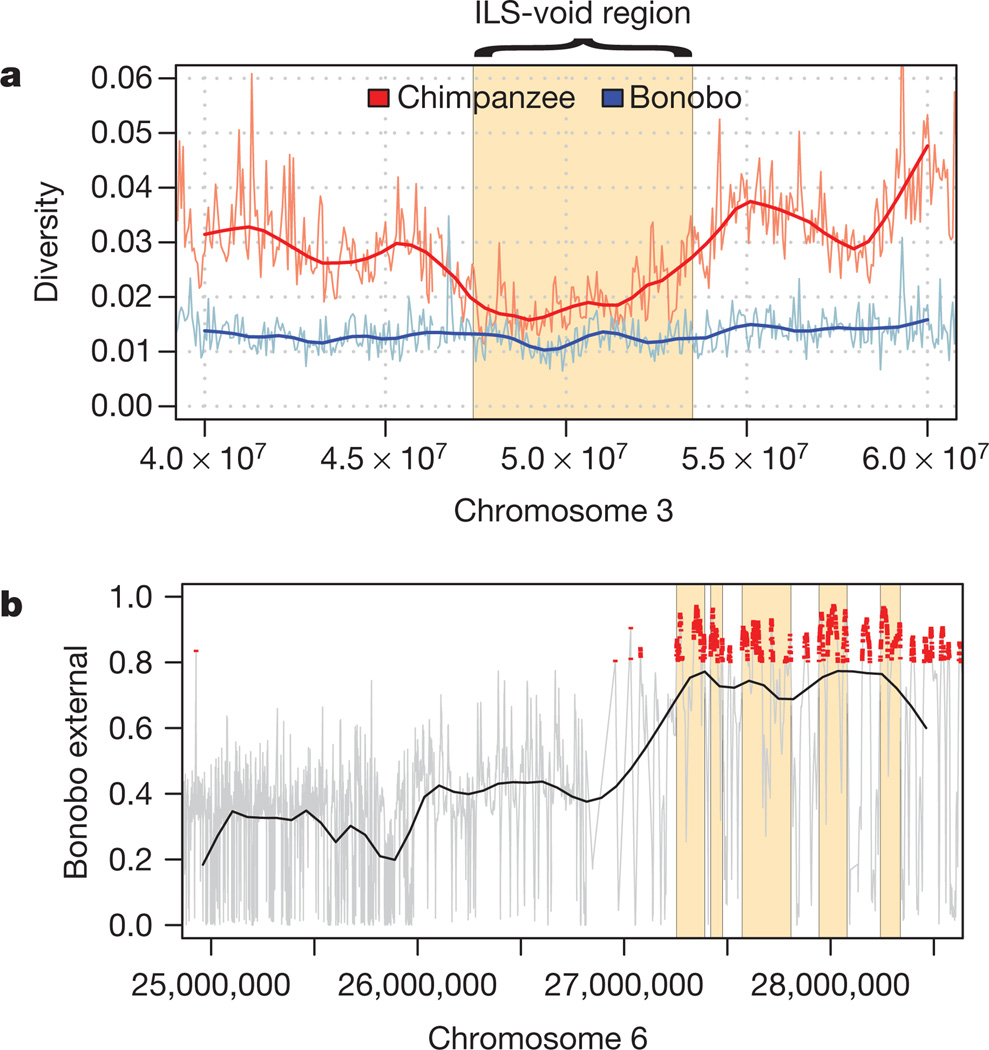
Two African apes are the closest living relatives of humans: the chimpanzee (Pan troglodytes) and the bonobo (Pan paniscus). Although they are similar in many respects, bonobos and chimpanzees differ strikingly in key social and sexual behaviours, and for some of these traits they show more similarity with humans than with each other. Here we report the sequencing and assembly of the bonobo genome to study its evolutionary relationship with the chimpanzee and human genomes. We find that more than three per cent of the human genome is more closely related to either the bonobo or the chimpanzee genome than these are to each other. These regions allow various aspects of the ancestry of the two ape species to be reconstructed. In addition, many of the regions that overlap genes may eventually help us understand the genetic basis of phenotypes that humans share with one of the two apes to the exclusion of the other.


Figures

Figure 1
Figure 1. Geographical distribution and test for admixture between chimpanzees and bonobos
a, Geographical distribution of bonobos and chimpanzees. b, D statistics for the admixture test between bonobos and three chimpanzee groups. Each pairwise comparison between one bonobo and two chimpanzee groups is depicted as one panel. Each point in a panel represents one bonobo individual compared with two chimpanzee individuals from different groups. Admixture between bonobo and chimpanzee is indicated by a Z-score greater than 4.4 or less than −4.4.
Figure 2
Figure 2. Segmental duplications and transposon accumulation
a, Venn diagram showing segmental duplications in the human (H), chimpanzee (C) and bonobo (B) genomes. Each number of megabases refers to the total amount of sequence that occurs in segmental duplications (Supplementary Information, section 4). b, Accumulation of different retrotransposon classes on each lineage.
Figure 3
Figure 3. Incomplete lineage sorting
a, Schematic description of ILS states and percentage of bases assigned to each state. b, Effective population sizes and split times inferred from ILS and based on a molecular clock with a mutation rate of 10−9 yr−1. Myr, million years. We note that other estimates of mutation rates will correspondingly affect the estimates of the split times. c, Overlap between predicted ILS transposons and the closest HMM ILS assignments within 100 bp of a transposon insertion. d, Proportion of ILS in exons, introns and across the whole genome, counted within ~1-Mb segments of alignment (Supplementary Information, section 8). e, Proportion of ILS dependent on recombination rates. Errors, 95% confidence interval.
Figure 4
Figure 4. X/A ratios
The X/A ratios for Ulindi (bonobo), an African human and a European human were inferred from heterozygosity, and that for the Pan ancestor was inferred from ILS. The low X/A ratio for the European has been suggested to be due to demographic effects connected to migrating out of Africa. Errors, 95% confidence interval (Supplementary Information, sections 8 and 9).
Figure 5
Figure 5. Selection in the bonobo–chimpanzee common ancestor and chimpanzees
a, Diversity in chimpanzee and bonobo around the region on chromosome 3 devoid of ILS. b, Regions where bonobos fall outside the variation of chimpanzee upstream of the MHC. The MHC region is not plotted because the SNP density is sparse there as a result of duplications. Five regions among the 50 longest regions are shown in yellow. Red points show posterior probabilities >0.8.

References

    1. Boesch C, Hohmann G, Marchant L. Behavioural Diversity in Chimpanzees and Bonobos. Cambridge Univ. Press; 2002.
    1. de Waal F, Lanting F. Bonobo: the Forgotten Ape. Univ. California Press; 1997.
    1. Hare B, Wobber V, Wrangham R. The self-domestication hypothesis: evolution of bonobo psychology is due to selection against aggression. Anim. Behav. 2012;83:573–585.
    1. Kano T. The Last Ape: Pygmy Chimpanzee Behavior and Ecology. Stanford Univ. Press; 1992.
    1. Fischer A, et al. Bonobos fall within the genomic variation of chimpanzees. PLoS ONE. 2011;6:e21605. - PMC - PubMed

Publication types

Substances

Associated data