. 2012 Jul 19;487(7407):370-4.
doi: 10.1038/nature11184.

Proto-genes and de novo gene birth

Affiliations

Proto-genes and de novo gene birth

Anne-Ruxandra Carvunis et al. Nature. .

Abstract

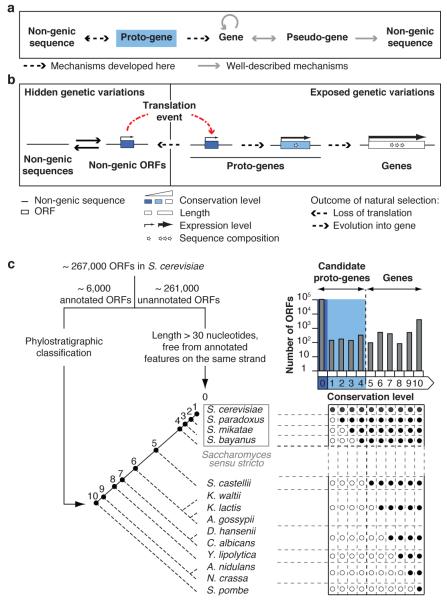
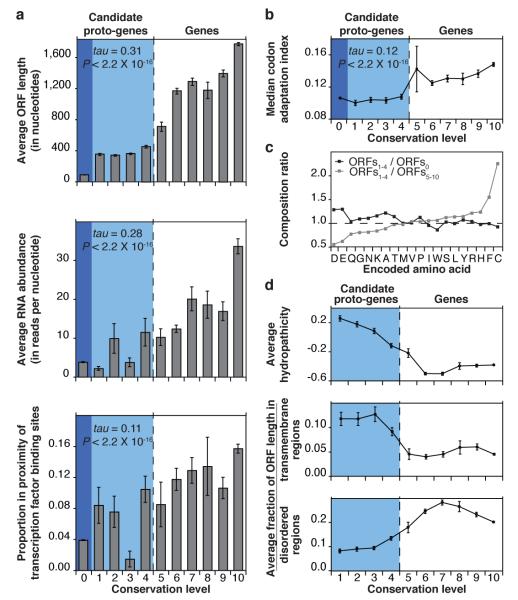
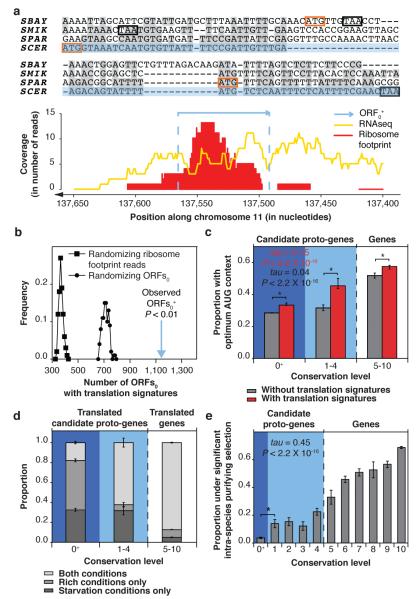
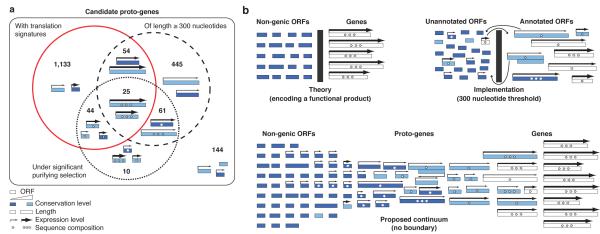
Novel protein-coding genes can arise either through re-organization of pre-existing genes or de novo. Processes involving re-organization of pre-existing genes, notably after gene duplication, have been extensively described. In contrast, de novo gene birth remains poorly understood, mainly because translation of sequences devoid of genes, or 'non-genic' sequences, is expected to produce insignificant polypeptides rather than proteins with specific biological functions. Here we formalize an evolutionary model according to which functional genes evolve de novo through transitory proto-genes generated by widespread translational activity in non-genic sequences. Testing this model at the genome scale in Saccharomyces cerevisiae, we detect translation of hundreds of short species-specific open reading frames (ORFs) located in non-genic sequences. These translation events seem to provide adaptive potential, as suggested by their differential regulation upon stress and by signatures of retention by natural selection. In line with our model, we establish that S. cerevisiae ORFs can be placed within an evolutionary continuum ranging from non-genic sequences to genes. We identify ~1,900 candidate proto-genes among S. cerevisiae ORFs and find that de novo gene birth from such a reservoir may be more prevalent than sporadic gene duplication. Our work illustrates that evolution exploits seemingly dispensable sequences to generate adaptive functional innovation.


Figures

Fig. 1
Fig. 1. From non-genic sequences to genes through proto-genes
a, Proto-genes mirror for gene birth the well-described pseudo-genes for gene death. Circular arrow: gene origination from pre-existing genes, such as through gene duplication. Pseudo-genes are highly related to existing genes but have accumulated disabling mutations and translation of functional proteins is no longer possible. The premise that pseudo-gene formation represents irreversible gene death has been challenged by reports of pseudo-gene resurrection (bidirectional arrow). After enough evolutionary time pseudo-gene decay renders them indistinguishable from non-genic sequences (unidirectional arrow). Whereas pseudo-genes resemble known genes, proto-genes resemble no known genes. Proto-genes arise in non-genic sequences and either revert to non-genic sequences or evolve into genes (bidirectional arrow). There can be no reversion of genes to proto-genes (unidirectional arrow) since gene decay engenders pseudo-genes. b, Details of the proposed model for the gradual emergence of protein-coding genes in non-genic sequences via proto-genes. Full arrows indicate the reversible emergence of ORFs in non-genic transcripts, or of transcripts containing non-genic ORFs. Examples where transcript appearance precedes ORF appearance have been described,,, but the reverse order of events cannot be ruled out. Broken arrows representing expression level symbolize transcription (hidden genetic variation) or transcription and translation (exposed genetic variation). The variations in width of these arrows reflect changes in expression level resulting, at least in part, from changes in regulatory sequences. Sequence composition refers to codon usage, amino acid abundances and structural features. c, Assigning conservation levels to S. cerevisiae ORFs. Conservation levels of annotated ORFs were assigned according to comparisons along the reconstructed phylogenetic tree, by inferring their presence (full circles) or absence (empty circles) in the different species according to the phylostratigraphy principle (Supplementary Information). Top right: number of ORFs assigned to each conservation level (logarithmic scale).
Fig. 2
Fig. 2. Existence of an evolutionary continuum ranging from non-genic ORFs to genes through proto-genes
a, Length (top; error bars represent s.e.m.), RNA expression level (middle; error bars represent s.e.m.), and proximity to transcription factor binding sites (bottom; error bars represent standard error of the proportion) of ORFs correlate with conservation level. P and tau: Kendall’s correlation statistics. Estimation of RNA abundance from RNAseq in rich conditions. The positive correlation between proximity to transcription factor binding sites and conservation level is shown for a window of 200 nucleotides and holds when considering windows of 300, 400 and 500 nucleotides (Kendall’s tau = 0.14, 0.16, 0.17, respectively; P < 2.2 × 10⁻¹⁶ in each case). b, Codon bias increases with conservation level. Codon bias estimated using the codon adaptation index (Supplementary Information). P and tau: Kendall’s correlation statistics. Error bars represent s.e.m. The large s.e.m. observed for ORFs5 may be related to the whole genome duplication event (Supplementary Fig. 3). c,Relative amino acid abundances shift with increasing conservation level. For each encoded amino acid, the ratio between its frequency in ORFs1-4 and its frequency in ORFs5-10 (gray), or the ratio between its frequency in ORFs1-4 and its frequency in ORFs0 (black), is plotted. Enrichment of cysteine in proteins encoded by ORFs1-4 relative to those encoded by ORFs5-10 (P < 1.8 × 10−150, hypergeometric test) corresponds to 3.6 ± 0.1 residues (mean, s.e.m.) per translation product. d, Predicted structural features of ORF translation products correlate with conservation level. ORFs0 were not included in these analyses as their short length hinders the reliability of structural predictions. Error bars represent s.e.m.
Fig. 3
Fig. 3. Translation and adaptive potential of recently emerged ORFs
a, Example of an ORFs 0+ showing signatures of translation in starvation conditions. Syntenic regions in Saccharomyces sensu stricto species are aligned. Orange and black boxes: in-frame start and stop sites, respectively; SCER: S. cerevisiae; SPAR: S. paradoxus; SMIK: S. mikatae; SBAY: S. bayanus. b, Significance of the observed number of ORFs 0+. Distribution of the number of ORFs0 expected to show signatures of translation if the ribosome footprinting assay were non specific (as modelled by randomizing footprint reads positions 100 times; squares), or if the presence of ribosomes on non-genic transcripts were not related to the presence of ORFs0 (as modelled by randomizing ORFs0 positions 100 times; circles). P: empirical P value. c, AUG context of ORFs with and without translation signatures. The presence of an adenine at position -3 from the start codon indicates optimum AUG context (Supplementary Information). P and tau: Kendall’s correlation statistics. Asterisks (*) mark significant differences between ORFs with and without translation signatures (P < 0.05, Fisher’s exact test). d, Candidate proto-genes tend to undergo condition-specific translation. e, Signatures of intra-species purifying selection. The positive correlation holds when only considering ORFs that are free from overlap with ORFs1-10 (Supplementary Fig. 7), and is not entirely driven by the interdependence between strength of purifying selection and expression level (Supplementary Information),. Asterisk (*) marks a significant difference in proportion of ORFs under significant intra-species purifying selection between ORFs 0+ and ORFs1 (P = 0.0001, hypergeometric test). P and tau: Kendall’s correlation statistics. Error bars represent standard error of the proportion in all panels.
Fig. 4
Fig. 4. Identification of proto-genes in a continuum ranging from non-genic ORFs to genes
a, Characterization of candidate proto-genes (ORFs 0+ and ORFs1-4). Venn diagram not drawn to scale. b, The binary model of annotation (top) and the proposed continuum (bottom).

Comment in

Similar articles

Cited by

References

    1. Tautz D, Domazet-Loso T. The evolutionary origin of orphan genes. Nat. Rev. Genet. 2011;12:692–702. - PubMed
    1. Kaessmann H. Origins, evolution, and phenotypic impact of new genes. Genome Res. 2010;20:1313–1326. - PMC - PubMed
    1. Jacob F. Evolution and tinkering. Science. 1977;196:1161–1166. - PubMed
    1. Siepel A. Darwinian alchemy: Human genes from noncoding DNA. Genome Res. 2009;19:1693–1695. - PMC - PubMed
    1. Khalturin K, Hemmrich G, Fraune S, Augustin R, Bosch TC. More than just orphans: are taxonomically-restricted genes important in evolution? Trends Genet. 2009;25:404–413. - PubMed

Publication types