

doi: 10.1038/nature11142.
A map of nucleosome positions in yeast at base-pair resolution
Affiliations
- PMID: 22722846
- PMCID: PMC3786739
- DOI: 10.1038/nature11142
Item in Clipboard
A map of nucleosome positions in yeast at base-pair resolution
Nature.
.
Abstract
The exact positions of nucleosomes along genomic DNA can influence many aspects of chromosome function. However, existing methods for mapping nucleosomes do not provide the necessary single-base-pair accuracy to determine these positions. Here we develop and apply a new approach for direct mapping of nucleosome centres on the basis of chemical modification of engineered histones. The resulting map locates nucleosome positions genome-wide in unprecedented detail and accuracy. It shows new aspects of the in vivo nucleosome organization that are linked to transcription factor binding, RNA polymerase pausing and the higher-order structure of the chromatin fibre.
Figures

a, Nucleosome structure, highlighting histone H4 (green) and residue serine 47(pink), which is mutated to a cysteine where the sulfhydryl-reactive label covalently binds. b, Ethidium bromide stained agarose gel showing the chemical mapping results in a DNA banding pattern, which occurs only when the reaction includes (indicated by “+”) the sulfhydryl-reactive label, copper, H2O2, and the H4S47C mutant yeast. The cartoons adjacent to the agarose gel illustrate mapping successive nucleosomes’ centers produced the banding pattern. c, Locations of dominant hydroxyl radical cleavages relative to the nucleosome center (base pair 0).
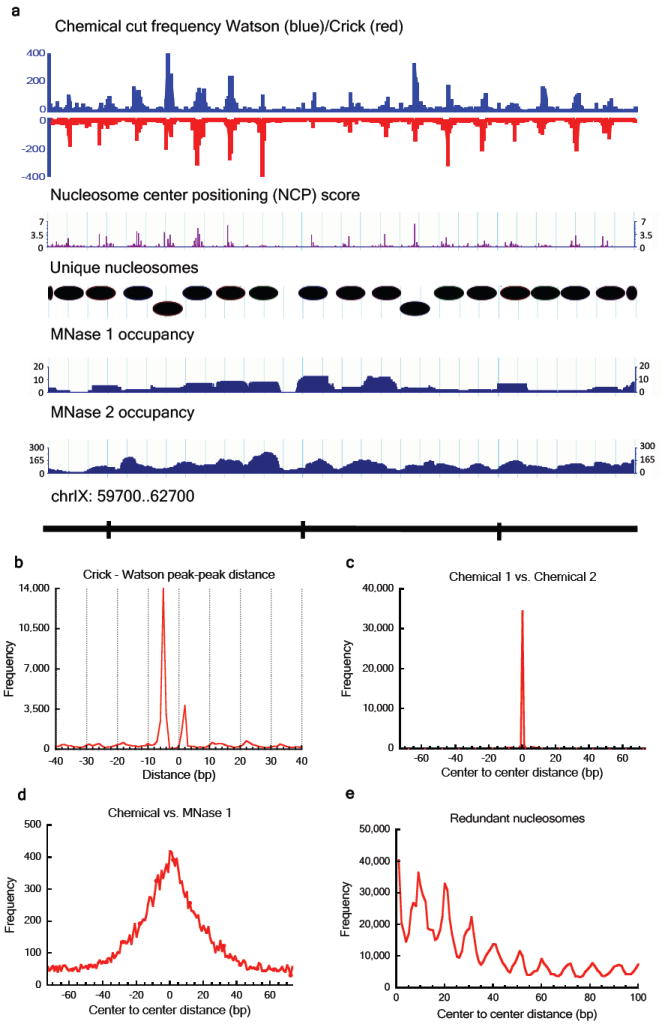
a, Screenshot of raw data, nucleosome center positioning score (NCP score), defined unique nucleosomes and two MNase maps (MNase 1 and MNase 2 ). b, Crick – Watson cleavage peak-peak distances showing two dominant distances: +2 and -5 nucleotides. c, Distances between the nearest nucleosome centers in two independent chemical maps and d, in the combined chemical map vs. the MNase 1 map. e. Distance between nucleosome centers in the redundant map showing preferential spacing of multiples of ~10 bp.

a. Position-dependent frequencies of AA, AT, TA, or TT dinucleotides in the chemical map, by quartiles of NCP score/noise ratio. b, Comparison of dinucleotide frequency between the chemical map and the MNase 1 map. The chemical map shows significantly stronger AA/AT/TA/TT dinucleotide signals suggesting an improved center alignment of nucleosomal DNA. c, 5-mer preferences of nucleosomes (left) and linker DNA regions (right) in chemical map compared to the MNase 1 map, colored by numbers of A or T nucleotides.

a, Genome-wide average nucleosome occupancy across all sites in the chemical map plotted relative to transcription start sites (TSSs, 3017 in total), open reading frame (ORF) ends (center), and tRNA start sites (right). b, AA/AT/TT/TA dinucleotide frequency within nucleosomes for nucleosome classes +1, +4 and +6 from the chemical map and the MNase 2 map.

a, Linker length distribution for all ~67,000 unique nucleosomes (black), for the top 50% nucleosomes with highest NCP score/noise ratio (red) and for ~45,000 MNase 2 unique nucleosomes (blue). b, AA/AT/TA/TT frequency in the genomic DNA flanking the nucleosomes. c, Fourier transform of AA/AT/TA/TT signals in the unique nucleosomes (red), in downstream flanking regions (black), and the mean (blue) and 95th percentile (green) of transform in the flanking regions after permuting the phase offset between the flanking region and the mapped nucleosome (Methods).

a, Frequency of functional Abf1 sites (left) and the average motif score calculated using position weight matrix for Abf1 (right) relative to nucleosome centers. b, Frequency of all even length functional TF binding sites (top) and Hermes transposon integration sites (bottom) relative to the nucleosome centers. c, Frequencies of RNA polymerase II pause sites mapped inside nucleosomes +2 to +4 relative to the nucleosome centers, for wildtype yeast cells (top) and dst1- Δ yeast cells (lacks polymerase backtracking ability; bottom).
References
Publication types
MeSH terms
Substances
Associated data
- Actions
Grants and funding
LinkOut - more resources
Full Text Sources
Other Literature Sources
Molecular Biology Databases
