. 2012 Jun 28;486(7404):549-53.
doi: 10.1038/nature11132.

PPAR-γ is a major driver of the accumulation and phenotype of adipose tissue Treg cells

Affiliations

PPAR-γ is a major driver of the accumulation and phenotype of adipose tissue Treg cells

Daniela Cipolletta et al. Nature. .

Abstract

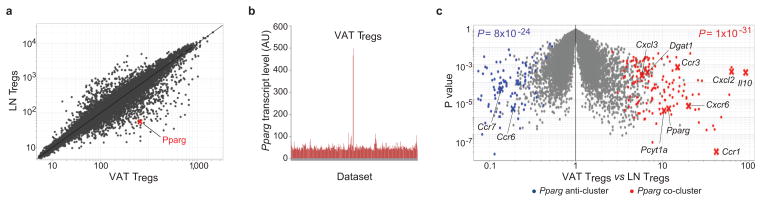
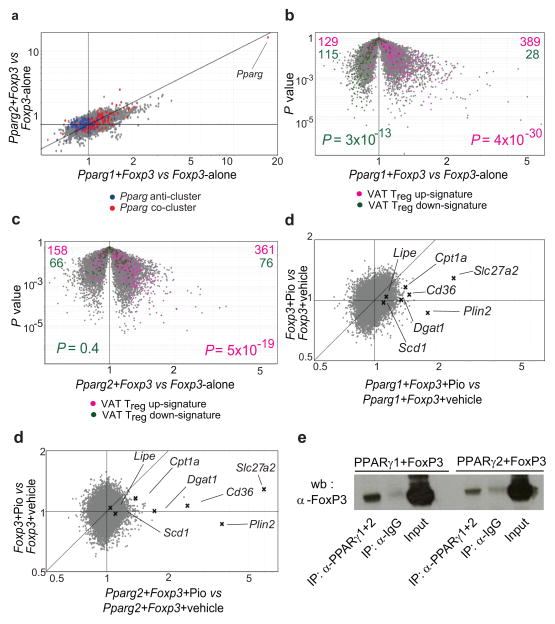
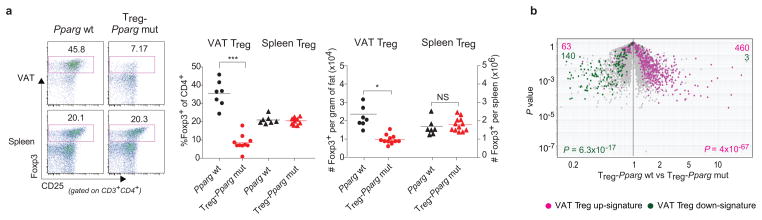
Obesity and type-2 diabetes have increased markedly over the past few decades, in parallel. One of the major links between these two disorders is chronic, low-grade inflammation. Prolonged nutrient excess promotes the accumulation and activation of leukocytes in visceral adipose tissue (VAT) and ultimately other tissues, leading to metabolic abnormalities such as insulin resistance, type-2 diabetes and fatty-liver disease. Although invasion of VAT by pro-inflammatory macrophages is considered to be a key event driving adipose-tissue inflammation and insulin resistance, little is known about the roles of other immune system cell types in these processes. A unique population of VAT-resident regulatory T (Treg) cells was recently implicated in control of the inflammatory state of adipose tissue and, thereby, insulin sensitivity. Here we identify peroxisome proliferator-activated receptor (PPAR)-γ, the 'master regulator' of adipocyte differentiation, as a crucial molecular orchestrator of VAT Treg cell accumulation, phenotype and function. Unexpectedly, PPAR-γ expression by VAT Treg cells was necessary for complete restoration of insulin sensitivity in obese mice by the thiazolidinedione drug pioglitazone. These findings suggest a previously unknown cellular mechanism for this important class of thiazolidinedione drugs, and provide proof-of-principle that discrete populations of Treg cells with unique functions can be precisely targeted to therapeutic ends.


Conflict of interest statement

Conflict of interest: D.M., C.B., M.F. and S.S. have a patent pending on fat Tregs.

Figures

Fig. 1
Fig. 1. Transcripts directly or inversely correlated with Pparg expression in VAT Tregs
(a) Microarray analysis. Normalized expression values for transcripts isolated from Tregs from epididymal fat versus LN of 30-week-old retired-breeder B6 males (in triplicate). (b) Expression of Pparg in a library of microarray datasets from diverse T cell populations: different subsets, activation statuses, or location. (c) A volcano plot comparing gene expression in VAT and LN Tregs of NC-fed B6 mice. The Pparg co- and anti-cluster transcripts defined in Suppl. Fig. 1b are superimposed in red and blue, respectively. Some of the characteristic of VAT Treg genes are indicated. P values from a chi-square test.
Fig. 2
Fig. 2. Cooperation between PPARγ and Foxp3
Naive CD4+CD25 T cells were stimulated ex vivo and transduced with retroviruses encoding Foxp3 (MSCV IRES-GFP) plus Pparg1 or Pparg2 (both MSCV IRES-Thy1.1). Cells were sorted for green-fluorescent protein (GFP) and/or Thy1.1 positivity before RNA processing. (a) An FC/FC plot comparing gene-expression values for double-transductants expressing Pparg1 and Foxp3 versus single-transductants expressing Foxp3 only (x-axis) vis-á-vis double-transductants expressing Pparg2 and Foxp3 versus single-transductants expressing Foxp3 (y-axis). Pparg co-cluster and anti-cluster genes are superimposed in red and blue, respectively. (b, c) Genes from the VAT Treg up- and down-signature highlighted in pink and green, respectively, on a volcano plot comparing P value versus FC for probes from double-transductants expressing Foxp3 and Pparg1 or Foxp3 and Pparg2 versus single-transductants expressing Foxp3 alone. The VAT Treg up- and down-signatures were defined as described in Methods. P values from a chi-square test. (d, e) 24 hours after transduction of naïve CD4+ T cells, double-transductant (Pparg1+Foxp3 or Pparg2+Foxp3) or single-transductant (Foxp3 alone) cultures were treated with Pio (1μM) for 48 hours. FC/FC plots comparing gene expression values of Pio-treated versus vehicle-treated double-transductants expressing Pparg1 or Pparg2 plus Foxp3 (x axis) vis-á-vis Pio-treated versus vehicle-treated single-transductants expressing Foxp3 alone (y axis). Some genes involved in lipid metabolism are indicated. Mean expression values calculated from three independent experiments. (f) Association of Foxp3 with PPARγ determined by co-immunoprecipitation. Anti-PPARγ1+2 antibody was used to immunoprecipitate PPARγ1 or PPARγ2 from nuclear lysates of HEK293 cells co-transduced with Foxp3 and Pparg1 or Pparg2. Immunoblots were probed with anti-Foxp3.
Fig. 3
Fig. 3. In vivo effects of abrogating PPARγ expression specifically in Tregs
(a) Treg representation. Cells were isolated from the spleen or stromovascular fraction (SVF) of epididymal fat (epi-fat) of 25-week-old mice lacking PPARγ specifically in Tregs (Treg-pparg mut) or littermate controls (Pparg wt). Tregs are defined as CD45+CD3+CD4+Foxp3+. Left, representative dot plots (of at least 3 experiments); center, summary data (for fraction of CD4+ cells); right, numbers per gram of tissue. Dot plot numbers indicate the percentage of cells in that gate for that particular experiment. P values according to the Student’s T test: *P<0.05, **P<0.01, ***P< 0.001; NS=not significant. Error bars represent the mean ± SD. (b) Expression of VAT Treg signature genes in Treg-Pparg mut mice. A volcano plot comparing P value versus FC for probes from wt versus mutant VAT Tregs. Genes from the VAT Treg up- and down-signature are highlighted in pink and green, respectively. P determined by the chi-square test.
Fig. 4
Fig. 4. Pio promotion of epididymal fat Treg numbers and phenotype
At 9 weeks of age, Pparg wt and Treg-Pparg mut mice were fed HFD +/− Pio for 13 weeks. Cells from the spleen and epididymal fat SVF were stained and analyzed by flow cytometry. Numbers on dot plots indicate the percentage of cells in that gate for that particular experiment (representative of ≥3 experiments). (a) Tregs from Pparg wt mice on HFD +/− Pio. Left, representative dot plots; right, summary data. (b) Expression of VAT Treg signature genes in Pparg wt mice on HFD+/−Pio. A volcano plot comparing P value versus FC for probes from VAT Tregs isolated from Pparg wt mice on HFD+Pio versus HFD alone. Genes from the VAT Treg up- and down-signature are highlighted in pink and green, respectively. P determined by the chi-square test. (c) MFI of CD36 expression by Tregs. ΔMFI indicates, for gated CD3+CD4+Foxp3+ cells, the difference in CD36 expression for HFD-fed mice +/− Pio treatment. Epi-fat ΔMFI = 3828±1362 (*P=0.039); spleen ΔMFI = −182±597 (NS). (d) Cells were isolated from the spleen or epi-fat SVF of B6.Foxp3-(YFP−)Cre mice kept on HFD+/−Pio for 13 weeks, and stained for CD3, CD4 and Nile red. *P=0.01. (e) Treg fraction. Cells from spleen or epi-fat SVF were stained and analyzed by flow cytometry. (f) Insulin sensitivity. Mice were assessed for blood fasting-glucose and fasting-insulin levels. These values were used to calculate the HOMA-IR. (g) Glucose tolerance. Left: intraperitoneal GTT on wt mice. Center: GTT on mutant mice. Right: area under the curve (AUC) calculations. n=13–14 mice per group. P values calculated using the Student’s T test. Unless otherwise specified: *P<0.05, **P<0.01, ***P< 0.001; NS=not significant. Error bars represent the mean ± SD for immunological parameters, mean ± SE for metabolic parameters, as is standard practice in the respective fields.

Comment in

Similar articles

Cited by

References

    1. Osborn O, Olefsky JM. The cellular and signaling networks linking the immune system and metabolism in disease. Nat Med. 2012;18:363–374. - PubMed
    1. Feuerer M, et al. Lean, but not obese, fat is enriched for a unique population of regulatory T cells that affect metabolic parameters. Nat Med. 2009;15:930–939. - PMC - PubMed
    1. Winer S, et al. Normalization of obesity-associated insulin resistance through immunotherapy. Nat Med. 2009;15:921–929. - PMC - PubMed
    1. Ilan Y, et al. Induction of regulatory T cells decreases adipose inflammation and alleviates insulin resistance in ob/ob mice. Proc Natl Acad Sci U S A. 2010;107:9765–9770. - PMC - PubMed
    1. Tontonoz P, Spiegelman BM. Fat and beyond: the diverse biology of PPARgamma. Annu Rev Biochem. 2008;77:289–312. - PubMed

Publication types

MeSH terms

Associated data