Review
. 2012;4(5-6):509-28.
doi: 10.1159/000339153. Epub 2012 Jun 19.

Particulate systems for targeting of macrophages: basic and therapeutic concepts

Affiliations
Review

Particulate systems for targeting of macrophages: basic and therapeutic concepts

S M Moghimi et al. J Innate Immun. 2012.

Abstract

Particulate systems in the form of liposomes, polymeric micelles, polymeric nano- and microparticles, and many others offer a rational approach for selective delivery of therapeutic agents to the macrophage from different physiological portals of entry. Particulate targeting of macrophages and intracellular drug release processes can be optimized through modifications of the drug carrier physicochemical properties, which include hydrodynamic size, shape, composition and surface characteristics. Through such modifications together with understanding of macrophage cell biology, targeting may be aimed at a particular subset of macrophages. Advances in basic and therapeutic concepts of particulate targeting of macrophages and related nanotechnology approaches for immune cell modifications are discussed.


Figures

Fig. 1
Fig. 1
Examples of particulate drug carriers and functional nanoparticles for macrophage/monocyte targeting. Transmission electron microscopy (TEM) image of a multilamellar vesicle consisting of several lipid bilayers separated from one another by aqueous spaces (a) and a cryo-TEM image of small unilamellar vesicles consisting of a single bilayer surrounding the entrapped aqueous space (b). Drug molecules can be either entrapped in the aqueous space or intercalated into the lipid bilayer, depending on the physicochemical characteristics of the drug. The micrograph (c) is the scanning electron microscope image of polymeric nanospheres. These entities can be assembled from a variety of preformed synthetic polymers of different architecture (e.g. linear, di- and tri-block, cross-linked, dendronized) or by polymerization of monomers. Polymers of natural origin (e.g. albumin, gelatin, chitosan, hyaluronic acid) and pseudosynthetic polymers [e.g. poly (amino acids)] have also been used for nanoparticle construction. Polymeric nanoparticles are usually classified as either nanospheres or nanocapsules. In nanospheres, drugs or contrast agents are dispersed throughout the structure, whereas nanocapsules are composed of an oily or an aqueous drug-containing core surrounded by a polymeric membrane. d, e TEM images of two different types of polymeric micelles, respectively. Micelles are formed in solution as aggregates in which the amphiphilic component molecules are generally arranged in a spheroidal structure with hydrophobic cores shielded from water by a mantle of hydrophilic groups. These entities are used for solubilization of water-insoluble drugs. f Atomic force microscope image of single-walled carbon nanotubes (CNTs). CNTs are basically graphene sheets rolled up into hollow cylinders that can be many microns in length and typically with a small diameter. They consist of carbon atoms arranged in a hexagonal lattice, the physical properties of CNTs depend greatly on the diameter of the tubes and the orientation of the hexagons relative to the central CNT axis, which can be adjusted according to the purpose. CNTs can be divided in two groups, namely single-walled CNTs and multiwalled CNTs. Both exhibit interesting physical properties, such as high thermal stability, unique electronic characteristics that are very sensitive to their geometric structure as well as high mechanical strength combined with an ultra-low weight and large aspect ratio. These properties make CNTs attractive candidates for disease diagnosis and treatment, but are challenged by high toxicity.
Fig. 2
Fig. 2
Schematic representation of chemical strategies for coupling of biological ligands to the phospholipid headgroups on the surface of preformed liposomes. Procedures represent amine (a), carboxylic acid (b), aldehyde (c), hydrazine (d), maleimide (e), thiol (f), thiol (disulfide bond formation; g), bromoacetyl (h), cysteine (i), cyanur (j), p-nitrophenylcarbonyl (k), alkyne (l) and triphosphine (m) functionalization. Detailed chemical reactions are not shown. Modified with permission [117].
Fig. 3
Fig. 3
Capture of intravenously injected polymeric nanoparticles by rat Kupffer cells and splenic red-pulp macrophages. a Fluorescent light microscopy of rat liver after administration of fluorescently labeled polystyrene nanoparticles (60 nm in size). The fluorescence representing nanoparticles is localized in large quantities in Kupffer cells (arrow heads). b An electron micrograph of a rat Kupffer cell with ingested polystyrene nanoparticles (200 nm). c A micrograph of a Kupffer cell lysosome packed with 60 nm particles (scale bar = 100 nm). d An electron micrograph of the rat spleen red-pulp region showing accumulation of poloxamine 908-coated nanospheres (220 nm in size) in macrophages. These nanoparticles are resistant to ingestion by Kupffer cells. The micrograph also shows a venous sinus. Particles are filtered first at interendothelial cell slits before macrophage engulfment (nanoparticle filtration still proceeds after destruction of red-pulp macrophages by clodronate-containing liposomes). e An enlarged view of a red-pulp macrophage with ingested poloxamine 908-coated nanoparticles. Modified with permission [33,103].
Fig. 4
Fig. 4
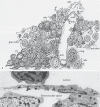
Schematic representation of hemopoietic bone marrow showing characteristic cellular associations in hemopoiesis and sinus structure (a) and electron micrograph of a rabbit bone marrow sinus endothelial cell (E) with ingested poloxamer 407-coated polystyrene nanoparticles (b). In a the sinus consists of endothelium (end), basement membrane and adventitial cells (adv). Apertures are present in the endothelium (diaphragmed), and hematopoietic cells, en route to the circulation, are passing through them. The sketch also shows a macrophage (mΦ), which extends a process into the lumen of the vascular sinus (a persinal macrophage) as well as megakaryocytes (meg), stromal cells (str), an erythroblastic islet (erb islet) and a granulocyte islet (gran islet). Macrophages are also associated with both islets. In b nanoparticles are 150 nm in size. Modified with permission [8,116].
Fig. 5
Fig. 5
The fate of polymeric nanoparticles injected into an intradermal region of the rat footpad. The top panel is a schematic diagram showing the location of lymph nodes draining the footpad region of the rat. Popliteal node (1) drains the footpad, foot and hind leg through lymph vessels running with greater and lesser saphenous veins. The efferent popliteal trunk follows the femoral vein to a retroperitoneal lymphatic plexus dorsal to the iliac vessels and the main trunk continues centrally to the iliac node (3), while smaller tributaries travel with the superficial epigastric vessels to the inguinal nodes (2). The position of the caudal node (4) is also shown. Following intradermal injection some nanoparticles (60 nm in this study) may aggregate (a); particles individually or in aggregated form (arrow and arrowheads) are prone to phagocytic clearance by the local macrophages (b). Particles also drain from the injection site into the initial lymphatic vessels; a blind-ended lymphatic vessel is shown in c. In lymphatic capillaries, numerous endothelial cells overlap extensively at their margin. d Following intradermal injection, many of the overlapped endothelial cells are separated and passageways, known as patent junctions, are provided between the interstitium and the lymphatic lumen. e A phagocyte of the subcapsular sinus from a regional draining node with captured drained nanoparticles (60 nm in diameter); note the presence of extracellular nanoparticle aggregates. Modified with permission [14]. Scale bar = 250 nm in a and 500 nm in b, d and e.
Fig. 6
Fig. 6
Stealth liposomes. Schematic diagram of a stealth liposome is shown in the left panel. The stealth property arises from covalent attachment of methoxypolyethylene glycol 2000 (mPEG2000) to phospholipids. A typical stealth vesicle usually contains 5 mol% of mPEG-phospholipid. PEGylated liposomes can still activate the complement system (upper right). Despite complement activation these liposomes exhibit prolonged circulation times in the blood. Scintigraphic images of 2 rats at 4 h postinjection of 99mTcO4 labeled stealth liposomes are shown in the lower right panel. The images show strong activity in the heart region (representing the rat blood pool), but poor activity in both the liver and spleen. At 4 h, approximately 70% of the injected liposomes were still in the circulatory blood pool. Hepatic and splenic sequestration accounted for 14 and 2.5% of the injected dose, respectively.
Fig. 7
Fig. 7
The effect of poloxamer 407 adlayer thickness (δ) on lymphatic distribution of polystyrene nanoparticles at 6 h postinterstitial injection into rat footpads. Nanoparticles were 45.5 nm in size before coating with poloxamer 407. Extent of nanoparticle retention at the injection site (a) and distribution of drained nanoparticles among popliteal and iliac nodes (b). c Structure of poloxamer 407 and scanning electron micrographs of representative uncoated and poloxamer-coated nanoparticles. Nanoparticle packing arrangement is most regular when poloxamerδ ≥3.9 nm. The upper part is a schematic representation of a poloxamer molecule on a nanoparticle surface. At low poloxamer concentrations the surface is partly covered by poloxamer molecules. At such concentrations the ethylene oxide chains will be close to the nanoparticle surface (mushroom configuration) due to a large available surface area per adsorbed poloxamer molecule. Ethylene oxide chains will assume a ‘brush-like’ configuration at high concentrations of poloxamer. This is due to a smaller available surface area per adsorbed poloxamer molecule and repulsive forces arising from the ether oxygen atoms of projecting ethylene oxide chains (larger δ values). Modified with permission [35].
Fig. 8
Fig. 8
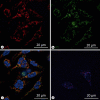
Live-cell microscopy of rat peritoneal macrophages treated with a newly engineered PEGylated polymer micelle for 1 h at 37°C. Polymer micelles are dynamic structures and are in equilibrium with monomers with the concentration of monomers being equal to the critical micelle concentration. The results demonstrate translocation of internalized monomer chains (covalently labeled with rhodamine B) to the mitochondrial network (a) and mitochondria stained with Mitotracker Green (b). c Merged images of a and b together with H33342 nuclear stain, confirming mitochondrial translocation of micelles. d Merged image showing that monomer chains do not colocalize with lysosome (lysosomes were stained with LysoTracker Blue). Neither the monomer nor micelle internalization occurred at 4°C. Imaging was performed on a Leica AF6000LX microscope using a 63×/1.47 oil objective with a 1.6 magnification and filters GFP (excitation band pass 475/40, emission band pass 530/50 nm), Cy3 (excitation band pass 555/25, emission band pass 605/52) and A4 (excitation band pass 360/40, emission band pass 470/40).
Fig. 9
Fig. 9
Positron emission tomography images of a mouse receiving an intravenous dose of stealth liposome. 64Cu radionuclide was used to label the liposomes and biodistribution was followed for 24 h. Initially the aorta, the main veins and the heart region gave the highest signal intensity (representing liposome presence in the systemic circulation). However, splenic and hepatic signal intensities increased at later time points. The images further illustrate that the spleen receives the highest liposome dose g–1 tissue followed by the liver, where resident macrophages (hepatic Kupffer cells and splenic marginal zone and red-pulp macrophages) are responsible for liposome clearance. Modified with permission [84].
Fig. 10
Fig. 10
The relationship between size and color of cadmium selenide quantum dots irradiated with a UV light. Quantum dots are semiconductors with electronic characteristics that are controlled by size and shape of individual crystals. By increasing the size, the emission wavelength of quantum dots may be tuned from blue to near infrared due to quantum confinement. Generally, the smaller the size and the larger the band gap, the greater the difference in energy between the highest valence band and the lowest conduction band becomes. As a result, more energy is required to excite the quantum dot and therefore more energy is released when the dot returns to its resting state. Quantum dots are not soluble in aqueous environments. For biological applications their surface must be modified (e.g. with polymer layers) to make them water dispersible. These approaches will dramatically increase the hydrodynamic size of the quantum dots (often in the order of 30–50 nm).
Fig. 11
Fig. 11
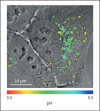
Image of internalized nanoparticle pH sensors in HepG2 cells. Image was obtained by confocal microscopy 24 h postnanoparticle challenge. The original image is converted into a color-coded illustration based on the pH gradient using a calibration curve and overlaid on the differential interference contrast image. The nanoparticle sensors are located in endosomes and lysosomes. Modified with permission [108].

Similar articles

Cited by

References

    1. Gordon S. Vol. 158. Berlin: Springer; 2003. The Macrophage as Therapeutic Target.
    1. Moghimi SM, Hunter AC, Murray JC. Long-circulating and target-specific nanoparticles: theory to practice. Pharmacol Rev. 2001;53:283–318. - PubMed
    1. Moghimi SM, Hunter AC, Murray JC. Nanomedicine: current progress and future prospects. FASEB J. 2005;19:311–330. - PubMed
    1. Taylor PR, Martinez-Pomarez L, Stacey M. Macrophage receptors and immune recognition. Ann Rev Immunol. 2005;23:901–944. - PubMed
    1. Sleyster EC, Knook DL. Relation between localization and function of rat liver Kupffer cells. Lab Invest. 1982;47:484–490. - PubMed

Publication types