. 2012 Aug 17;287(34):28480-94.
doi: 10.1074/jbc.M112.371138. Epub 2012 Jun 21.

Conformational changes relevant to channel activity and folding within the first nucleotide binding domain of the cystic fibrosis transmembrane conductance regulator

Affiliations

Conformational changes relevant to channel activity and folding within the first nucleotide binding domain of the cystic fibrosis transmembrane conductance regulator

Rhea P Hudson et al. J Biol Chem. .

Abstract

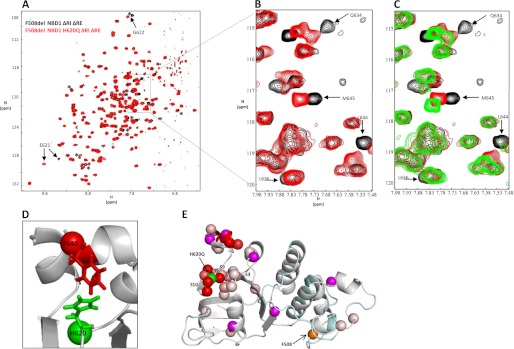
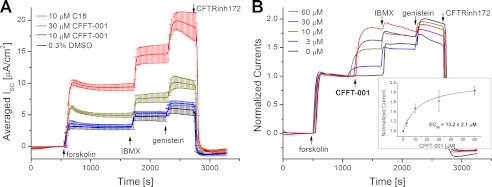
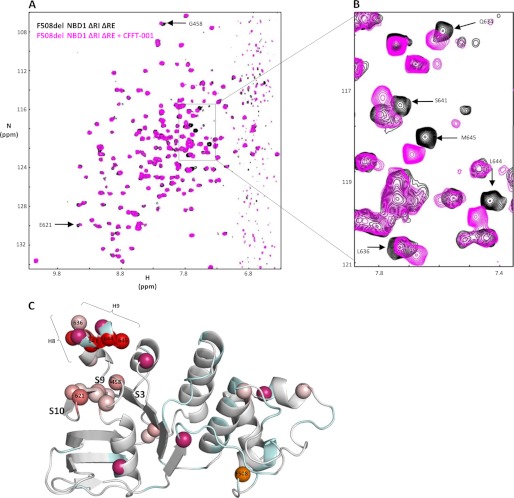
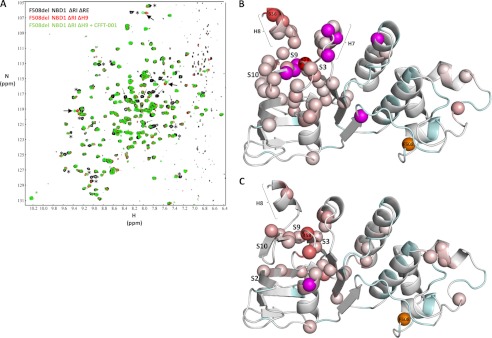
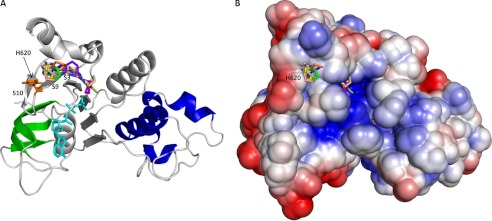
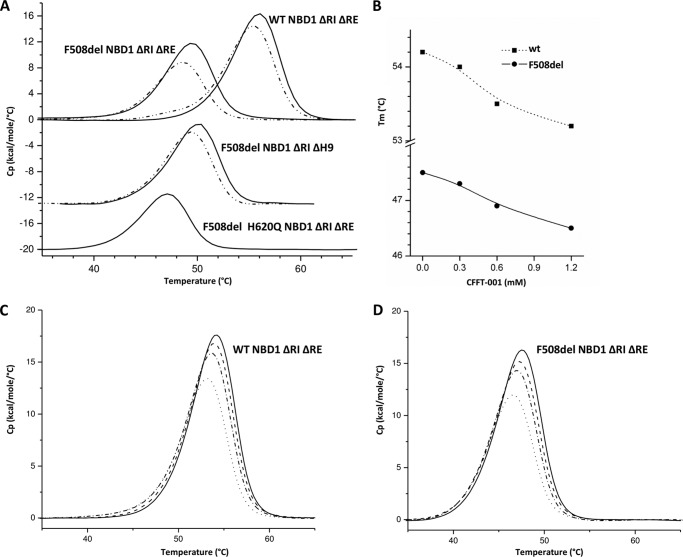
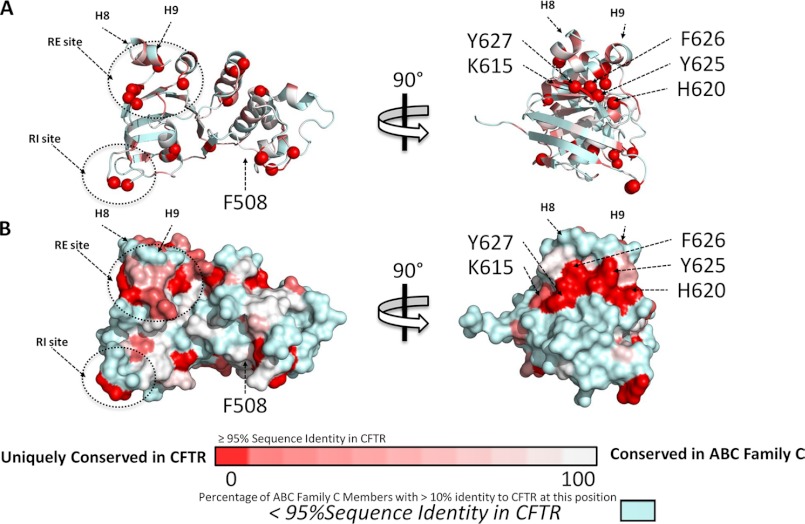
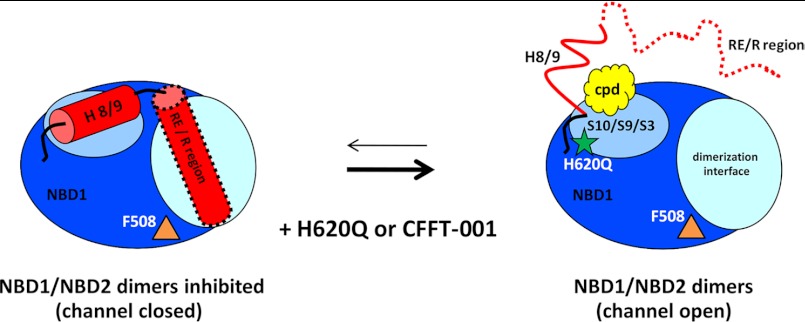
Deletion of Phe-508 (F508del) in the first nucleotide binding domain (NBD1) of the cystic fibrosis transmembrane conductance regulator (CFTR) leads to defects in folding and channel gating. NMR data on human F508del NBD1 indicate that an H620Q mutant, shown to increase channel open probability, and the dual corrector/potentiator CFFT-001 similarly disrupt interactions between β-strands S3, S9, and S10 and the C-terminal helices H8 and H9, shifting a preexisting conformational equilibrium from helix to coil. CFFT-001 appears to interact with β-strands S3/S9/S10, consistent with docking simulations. Decreases in T(m) from differential scanning calorimetry with H620Q or CFFT-001 suggest direct compound binding to a less thermostable state of NBD1. We hypothesize that, in full-length CFTR, shifting the conformational equilibrium to reduce H8/H9 interactions with the uniquely conserved strands S9/S10 facilitates release of the regulatory region from the NBD dimerization interface to promote dimerization and thereby increase channel open probability. These studies enabled by our NMR assignments for F508del NBD1 provide a window into the conformational fluctuations within CFTR that may regulate function and contribute to folding energetics.


Figures

FIGURE 1.
FIGURE 1.
Assignment of F508del NBD1 ΔRIΔRE. A, overlay of WT and F508del NBD1 15N-1H correlation spectra at 500 MHz. B, ribbon diagram of WT NBD1 ΔRIΔRE (PDB code 2PZE). The α- and β-subdomains and the ATP binding core are shown in blue, green, and gray, respectively. The C-terminal helices H8 and H9 are labeled. Red spheres represent the N atoms from residues not assigned in either WT or F508del (three red spheres representing residues Glu-391, Thr-390, and Pro-638 are obstructed from view). Yellow spheres are N atoms of residues not assigned in F508del. The orange sphere is the N atom of Phe-508. ATP is shown in cyan. The deletion site for the RI is indicated. C, using the same color coding as in B, these residues are shown in the amino acid sequence. In total, 82% of F508del NBD1 ΔRIΔRE has been assigned.
FIGURE 2.
FIGURE 2.
H620Q variant reduces helicity of H8 and H9 at the C terminus of F508del NBD1 ΔRIΔRE. A, overlay of 15N-1H correlation spectra at 500 MHz for F508del NBD1 ΔRIΔRE (black; background) and the H620Q variant, F508del H620Q NBD1 ΔRIΔRE (red; foreground). Arrows indicate a subset of peaks that shift in the mutant. Asterisks show a separate subset of peaks that shift in the H620Q variant but do not shift upon addition of CFFT-001. B, close-up of boxed area of A. C, same overlay as in B, with a third layer showing the addition of compound to the H620Q variant (green; foreground). D, side chain of His-620 interacting with the side chain of Phe-640. E, ribbon diagram of WT NBD1 ΔRIΔRE (2PZE) with unassigned residues in cyan, and assigned residues that do not shift upon H620Q mutation are shown in light gray. The N atoms for residues that show chemical shift changes upon mutation are shown as spheres colored with a linear gradient from light pink to red, where light pink corresponds to the smallest shifts (beginning at 7 Hz; see supplemental Fig. S3) and red to the largest shifts. The N atoms for residues whose chemical shift changes upon mutation yet cannot be identified with certainty are shown as magenta spheres. His-620 and Phe-508 are shown as green and orange spheres, respectively.
FIGURE 3.
FIGURE 3.
The dual-acting corrector-potentiator activity of CFFT-001. A, FRT cells stably expressing CFTR F508del were incubated for 24 h at 37 °C with either 0.3% DMSO, 10 or 30 μm CFFT-001, or 10 μm C18 before short circuit currents were recorded in Ussing chambers at 27 °C. The traces are base line-corrected averages of three individual recordings, except for the C18 positive control (n = 2). Error bars indicate the S.D. of the mean trace value. After a 20-min equilibration period and base-line acquisition, CFTR was activated maximally by additions of 10 μm forskolin, 100 μm IBMX, and 20 μm genistein prior to inhibition by 20 μm CFTR inhibitor 172 (CFTRinh172). Current increases due to CFFT-001 incubation are significant with p = 0.0059 (unpaired t test). B, current traces are averages of short circuit traces from cells that were incubated for 24 h with DMSO. Currents were normalized to the forskolin-elicited current (n = 3). After the forskolin-induced current stabilized, CFFT-001 was added to final concentrations of 0, 3, 10, 30, and 60 μm. Differences in the peak currents after all agonist additions, including 100 μm IBMX and 20 μm genistein, are not statistically significant. The inset shows the normalized current increases plotted against the corresponding dose of CFFT-001. Error bars are the S.D. of the mean current increases. The data were fitted with a Hill function (nH = 1, R2 = 0.996), which yielded an EC50 concentration of 13.2 ± 2.1 μm.
FIGURE 4.
FIGURE 4.
CFFT-001 compound reduces helicity of H8 and H9 in F508del NBD1 ΔRIΔRE. A, overlay of 15N-1H correlation spectra at 500 MHz for F508del NBD1 ΔRIΔRE in the absence (black; background) and presence of the final titration point (3:1) of CFFT-001 (magenta). CFFT-001 was added in 250, 500, and 750 μm apparent concentrations to a 250 μm sample of F508del NBD1 ΔRIΔRE. B, close-up of boxed area of A. Arrows in A and B indicate peaks that shift upon addition of compound. Compare Fig. 2, A and B, with Fig. 4, A and B. C, ribbon diagram of WT NBD1 ΔRIΔRE as described in Fig. 2 with the color gradient representing chemical shift changes due to compound addition.
FIGURE 5.
FIGURE 5.
Effect of deletion of helix H9 on CFFT-001 binding. A, overlay of 15N-1H correlation spectra at 500 MHz for 250 μm F508del NBD1 ΔRIΔRE (387–646, Δ405–436) (black; background) and 250 μm F508del NBD1 ΔRI ΔH9 (387–636, Δ405–436) with (green, foreground) and without (red, middle ground) CFFT-001 (750 μm apparent concentration). Small arrows indicate peaks that are lost as a result of the deletion, whereas asterisks mark peaks that are affected by the deletion. Large arrows indicate peaks that shift upon compound addition. B and C, ribbon diagrams of WT NBD1 as described in Fig. 2 with the color gradients for N atoms representing chemical shift changes upon deletion of H9 (B) and compound addition to F508del NBD1 ΔRIΔH9 (C).
FIGURE 6.
FIGURE 6.
Model of interaction of CFFT-001 with NBD1. Multiple binding modes for CFFT-001 interaction with F508del NBD1 ΔRIΔRE. A, ribbon diagram of WT NBD1 as in Fig. 1 with the compounds and ATP shown as stick models. Compounds in each binding mode are represented by different colors, whereas ATP and the side chain of His-620 are shown in cyan and orange, respectively. B, electrostatic surface representation of NBD1 (red, negative potential; blue, positive potential; white, hydrophobic) showing the same compounds as described in A.
FIGURE 7.
FIGURE 7.
Differential scanning calorimetry of NBD1. A, DSC traces for WT and F508del NBD1 ΔRIΔRE (upper curves) in the absence (solid lines) and presence (dashed lines) of CFFT-001; buffer includes 2 mm ATP. DSC traces for F508del NBD1 ΔRIΔH9 (middle curves) in the absence (solid line) and presence (dashed line) of CFFT-001; buffer includes 5 mm ATP. DSC traces for F508del H620Q NBD1 ΔRIΔRE (lower curve); buffer includes 2 mm ATP. B, concentration dependence of Tm for WT and F508del NBD1 ΔRIΔRE, in the presence of 1 mm ATP. Concentration-dependent DSC traces of data shown in B for WT NBD1 ΔRIΔRE (C) and F508del NBD1 ΔRIΔRE (D). Solid lines show the NBD1 alone; addition of CFFT-001 at respective concentrations of 0.3 mm (dashed lines), 0.6 mm (filled squares on a dashed line) and 1.2 mm (filled squares on a solid line).
FIGURE 8.
FIGURE 8.
Sequence conservation unique to CFTR. Sequence profiles were determined for each of the 12 ABC subfamily C members, including CFTR. Conservation values were mapped onto the structure of WT CFTR NBD1 (Protein Data Bank 2PZE). Residues with <95% conservation in CFTR (by sequence identity) are colored in light blue. Residues with >95% conservation are colored in a gradient from red to white, with the residues that are unique to CFTR in red, and the residues that are present (>10% sequence identity) in other subfamily C members colored from dark pink (one matching ABC) to white (11 matching ABCs). A, ribbon diagrams in two orientations, with the N atoms of unique residues shown as spheres. B, solvent accessible surfaces for the same two orientations.
FIGURE 9.
FIGURE 9.
Simplified schematic model for functional dynamics within NBD1. NBD1 (dark blue) is shown as residing in two populations in a dynamic equilibrium. When channels are closed, NBD1/NBD2 heterodimers are inhibited due to the steric hindrance of the RE/R region interacting with NBD1. Addition of compound or the H620Q mutation shifts this equilibrium by reducing H9 helicity and contacts with the NBD1, subsequently leading to release of the RE/R region from the dimerization interface, relieving the inhibition and facilitating NBD1/NBD2 heterodimerization and channel opening.

References

    1. Kerem B., Rommens J. M., Buchanan J. A., Markiewicz D., Cox T. K., Chakravarti A., Buchwald M., Tsui L. C. (1989) Identification of the cystic fibrosis gene: Genetic analysis. Science 245, 1073–1080 - PubMed
    1. Rommens J. M., Iannuzzi M. C., Kerem B., Drumm M. L., Melmer G., Dean M., Rozmahel R., Cole J. L., Kennedy D., Hidaka N. (1989) Identification of the cystic fibrosis gene: Chromosome walking and jumping. Science 245, 1059–1065 - PubMed
    1. Riordan J. R., Rommens J. M., Kerem B., Alon N., Rozmahel R., Grzelczak Z., Zielenski J., Lok S., Plavsic N., Chou J. L. (1989) Identification of the cystic fibrosis gene: Cloning and characterization of complementary DNA. Science 245, 1066–1073 - PubMed
    1. Lewis H. A., Buchanan S. G., Burley S. K., Conners K., Dickey M., Dorwart M., Fowler R., Gao X., Guggino W. B., Hendrickson W. A., Hunt J. F., Kearins M. C., Lorimer D., Maloney P. C., Post K. W., Rajashankar K. R., Rutter M. E., Sauder J. M., Shriver S., Thibodeau P. H., Thomas P. J., Zhang M., Zhao X., Emtage S. (2004) Structure of nucleotide-binding domain 1 of the cystic fibrosis transmembrane conductance regulator. EMBO J. 23, 282–293 - PMC - PubMed
    1. Ostedgaard L. S., Baldursson O., Welsh M. J. (2001) Regulation of the cystic fibrosis transmembrane conductance regulator Cl− channel by its R domain. J. Biol. Chem. 276, 7689–7692 - PubMed

Publication types

MeSH terms

Substances