. 2012 Aug 3;111(4):402-14.
doi: 10.1161/CIRCRESAHA.112.274530. Epub 2012 Jun 21.

Stimulated emission depletion live-cell super-resolution imaging shows proliferative remodeling of T-tubule membrane structures after myocardial infarction

Affiliations

Stimulated emission depletion live-cell super-resolution imaging shows proliferative remodeling of T-tubule membrane structures after myocardial infarction

Eva Wagner et al. Circ Res. .

Abstract

Rationale: Transverse tubules (TTs) couple electric surface signals to remote intracellular Ca(2+) release units (CRUs). Diffraction-limited imaging studies have proposed loss of TT components as disease mechanism in heart failure (HF).

Objectives: Objectives were to develop quantitative super-resolution strategies for live-cell imaging of TT membranes in intact cardiomyocytes and to show that TT structures are progressively remodeled during HF development, causing early CRU dysfunction.

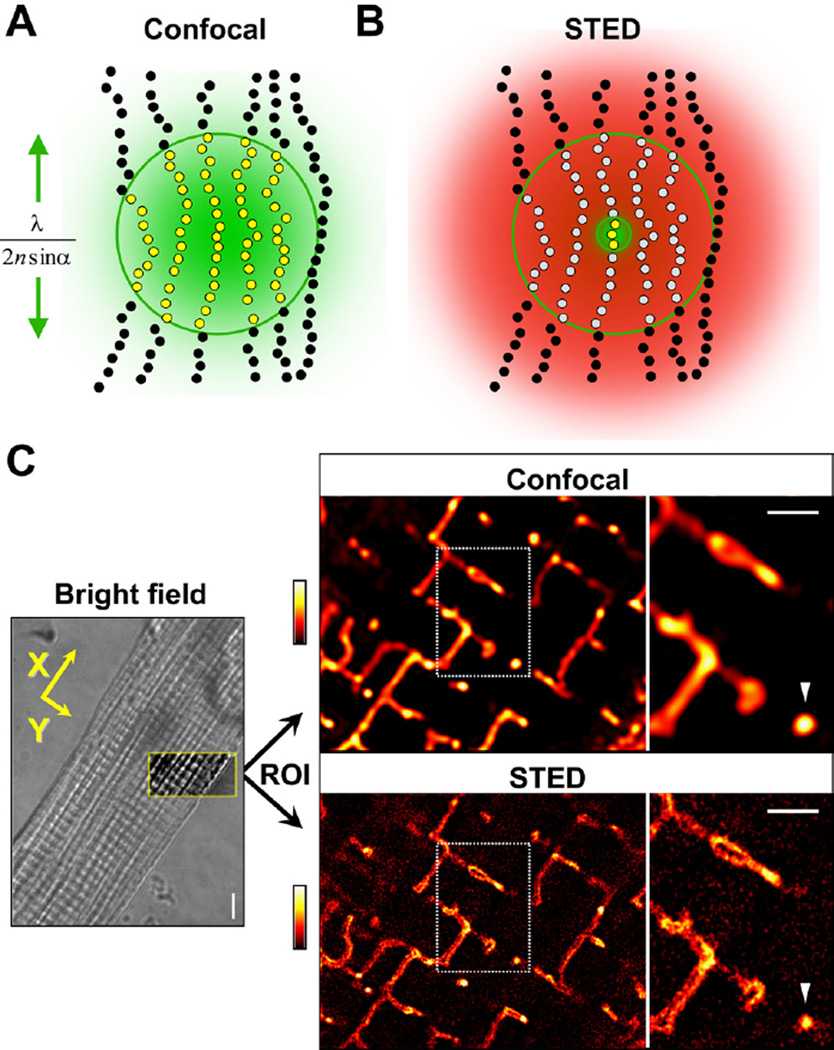
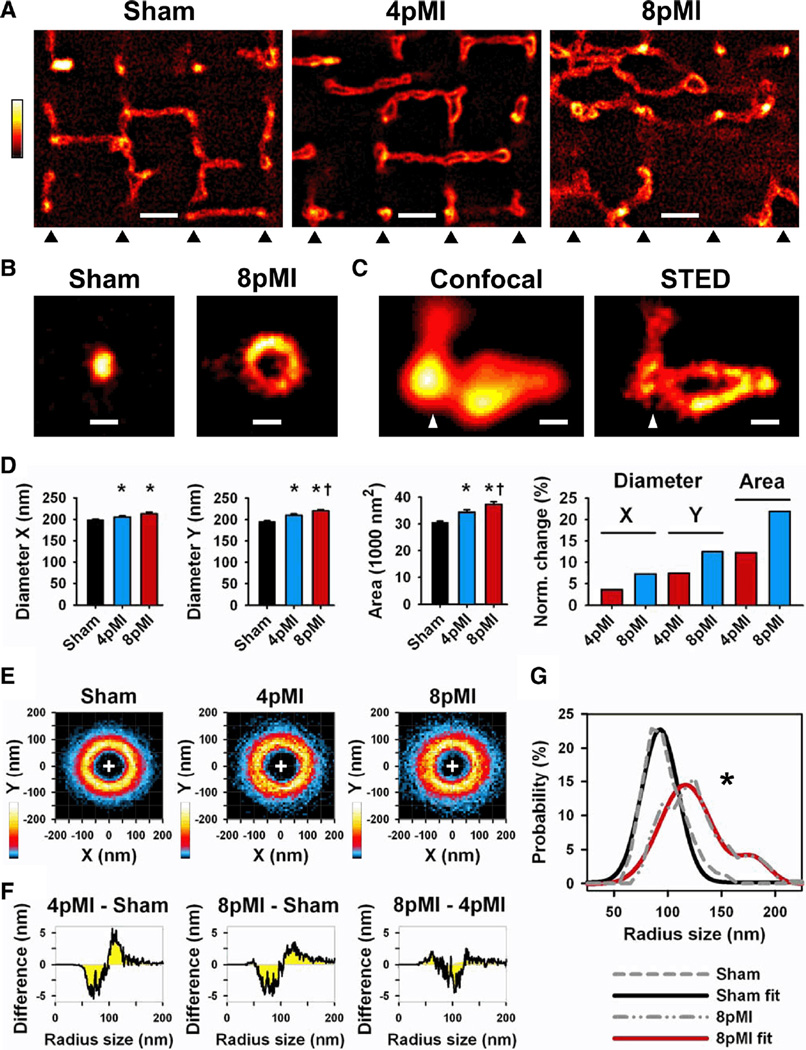
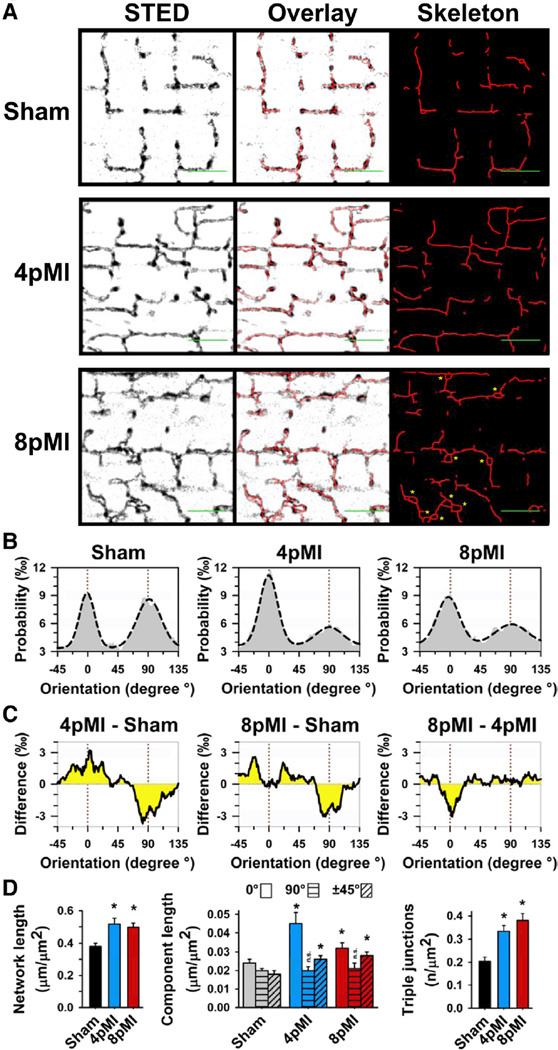
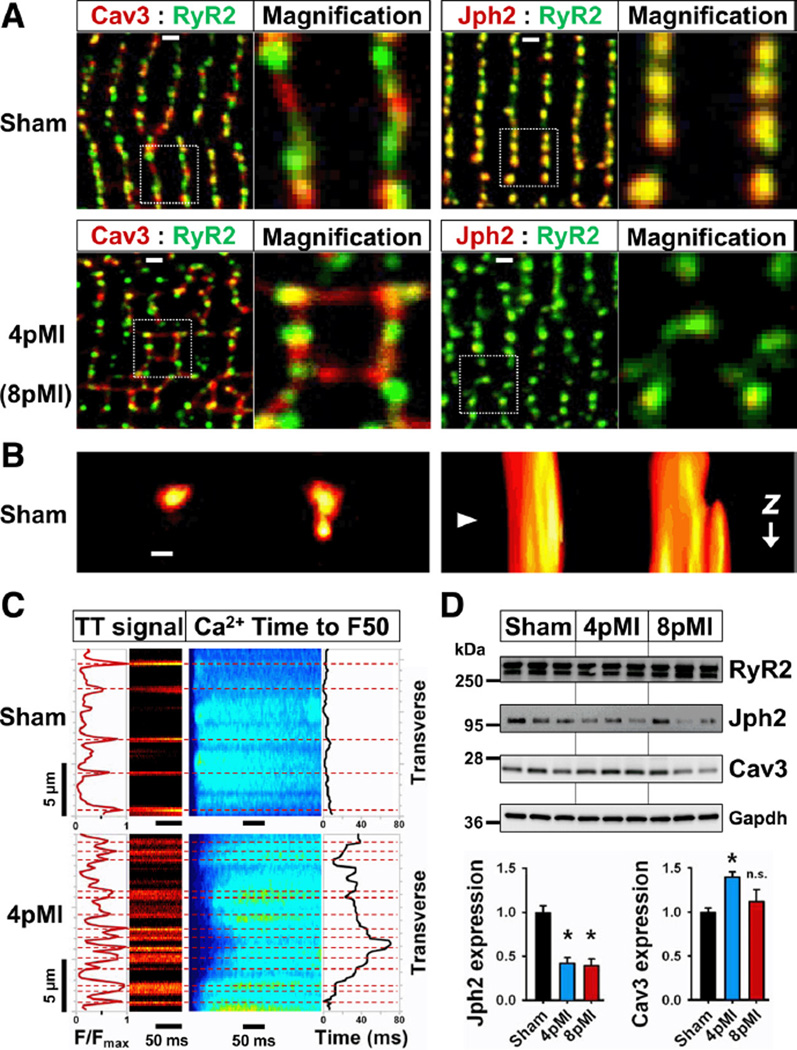
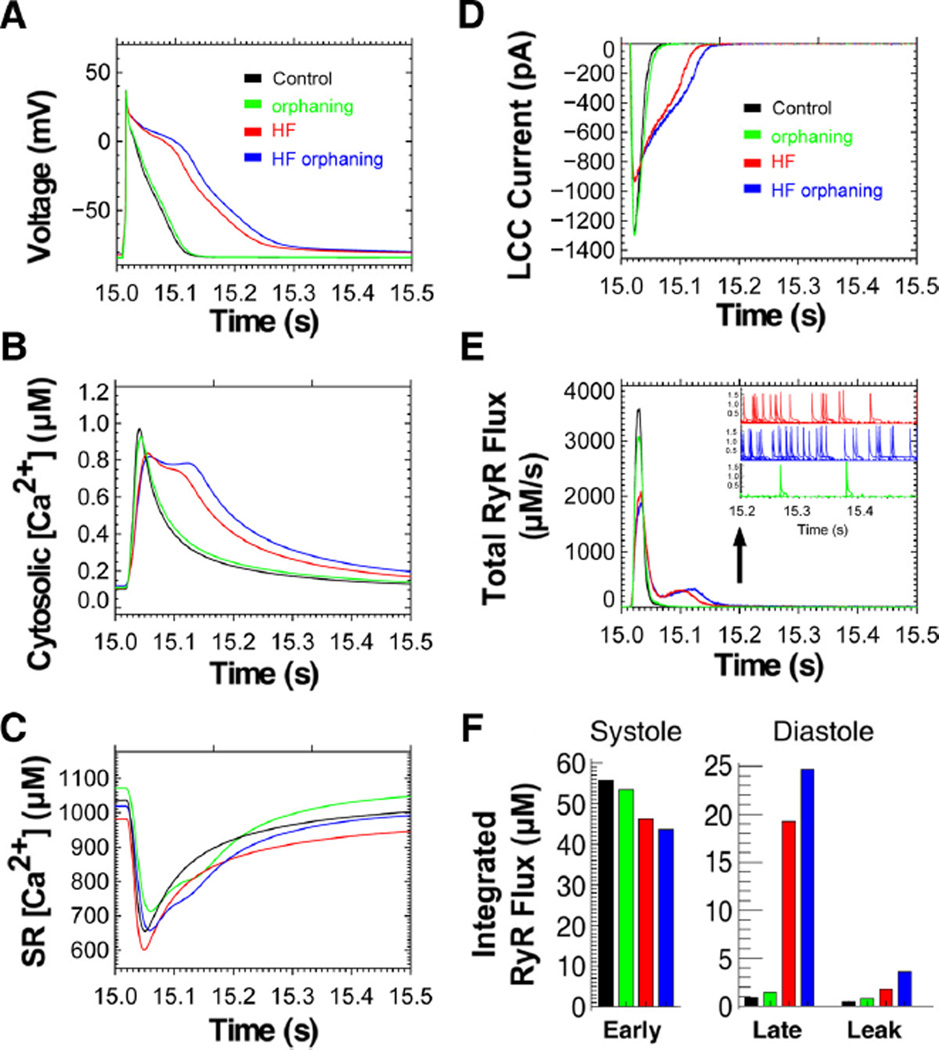
Methods and results: Using stimulated emission depletion (STED) microscopy, we characterized individual TTs with nanometric resolution as direct readout of local membrane morphology 4 and 8 weeks after myocardial infarction (4pMI and 8pMI). Both individual and network TT properties were investigated by quantitative image analysis. The mean area of TT cross sections increased progressively from 4pMI to 8pMI. Unexpectedly, intact TT networks showed differential changes. Longitudinal and oblique TTs were significantly increased at 4pMI, whereas transversal components appeared decreased. Expression of TT-associated proteins junctophilin-2 and caveolin-3 was significantly changed, correlating with network component remodeling. Computational modeling of spatial changes in HF through heterogeneous TT reorganization and RyR2 orphaning (5000 of 20 000 CRUs) uncovered a local mechanism of delayed subcellular Ca(2+) release and action potential prolongation.

Conclusions: This study introduces STED nanoscopy for live mapping of TT membrane structures. During early HF development, the local TT morphology and associated proteins were significantly altered, leading to differential network remodeling and Ca(2+) release dyssynchrony. Our data suggest that TT remodeling during HF development involves proliferative membrane changes, early excitation-contraction uncoupling, and network fracturing.


Figures

Figure 1
Figure 1. Imaging of intracellular TT membrane structures by confocal versus STED microscopy in living cardiomyocytes
A, Confocal microscopy: all fluorescent molecules within the focal spot region are excited and fluoresce (yellow dots); neighboring molecules are indistinguishable and biological structures appear blurred as indicated by the green area. The size (lateral extent) of the focal region indicated by the green line is a function of optical diffraction and determines resolution: λ/(2nsinα). Outside the focal region, molecules are not excited (black dots). B, STED: all peripheral fluorescing molecules are transiently deexcited into a dark state (gray dots) by light of sufficient intensity (red distribution) while exposed to the same focal excitation light. To realize the central region of zero intensity, the red STED laser beam is modified by a phase plate (inner green circle), confining fluorescence signals only to the zero center region (yellow dots) and a significantly smaller detection volume, resulting in higher resolution. Sufficiently high STED laser intensities confine arbitrarily small volumes of the zero center region. C, left, Transmitted light image (bright field) of the central cardiomyocyte section with the region of interest (ROI; framed yellow box) used for fluorescence imaging; scale, 5 µm. Yellow arrows indicate longitudinal (X) and transversal (Y) reference cell orientations for image analysis, corresponding with sarcomere orientations (striations). Right, Confocal and STED images of the same cardiomyocyte ROI showing TT membranes stained with di-8-ANEPPS. Dotted rectangles mark regions further magnified rightward. Arrowhead highlights exemplar “free” transversal TT cross section at a given striation; scale bars, 1 µm; fluorescence intensity coding as shown by look-up table.
Figure 2
Figure 2. STED nanoscopy shows transversal TT cross sections with subresolution dimensions in living cells
A, The same TT cross section was imaged by confocal and STED mode. STED shows the morphology of the TT cross section at 3.9 µm imaging z depth. Note: images are rotated according to X (horizontal) and Y (vertical) cell orientations as given by Figure 1B. Scale, 200 nm; colors indicate fluorescence intensity. B, Example of a TT cross section where STED resolved the underlying hollow membrane structure at 5.9 µm z depth. Scale, 200 nm. C, Histograms of diameter dimensions X and Y of the same 205 TT cross sections measured by confocal (upper) versus STED (lower) mode. Diameters represent full-width at half maximum (FWHM) determined by 2D Gauss fitting (see Methods). Vertical red line marks 220 nm, the confocal resolution limit. D, Same TT cross-section pairs as in A and B analyzed by 50% intensity threshold contour algorithm (see Methods). Graphs represent paired contour data each for confocal (black) and STED (red) mode. Note: only STED detected the underlying TT membrane morphology. E, Two-dimensional probability histograms of 205 contours each for confocal and STED mode. Color bar (right) indicates high (max) versus low (min) pixel probability; plus sign (+) is point of origin used for overlay of contour data. F, Median radius distribution from 205 individual TT contours (see Methods) each for confocal and STED mode (gray dashed lines; see legend in figure). STED imaging resulted in a significant leftward shift toward smaller radius sizes confirming faithful detection of subresolution structures (*P<0.05). Furthermore, Gaussian fitting confirmed that STED (red line) detected a wider distribution of smaller TT radius sizes as compared with confocal imaging (black line). Mean data are presented in Table 1.
Figure 3
Figure 3. Transversal TT cross sections in intact cardiomyocytes are progressively enlarged through heterogeneous remodeling during HF development
A, Comparison of striation-aligned STED images showing intracellular TT structures from sham, 4pMI, and 8pMI cells (bottom triangles indicate position of striations). TTs appear enlarged and misaligned in 4pMI and 8pMI cells. Scale, 1 µm. B, STED examples of TT cross sections from sham and 8pMI cells. Scale, 200 nm. C, Confocal versus STED images of a superenlarged TT cross section complex at 4pMI (triangle: position of striation). Scale, 200 nm. D, Longitudinal (X) and transversal (Y) diameters of TT cross sections were determined (see Methods). Bar graphs summarize mean TT diameters X and Y and cross-section area; right, change in TT cross-section dimensions normalized to sham. *P<0.05 versus sham; †P<0.05 versus 4pMI. E, Two-dimensional probability histograms of contours from TT cross-sections of indicated treatment groups (same cross-sections as in D). TT cross-sections were analyzed by automated contour algorithm (see Methods). Colors represent high (white) versus low (black) contour pixel probabilities as indicated. F, Difference integrals were calculated for radius size distributions between the indicated treatment groups. Radius sizes were determined from individual TT contours (see Methods); for example, at 4pMI-sham, a decrease of small versus an increase of large TT radius sizes occurred during HF development. G, Median radius size distributions were calculated from individual TT contours of sham and 8pMI cells (gray dashed lines). The 8pMI distribution is significantly right-shifted (*P<0.05). Furthermore, 2-peak Gaussian fitting of the 8pMI data (red line) confirmed a rightward shift and an additional second peak documenting heterogeneous changes of TT cross-sections. Mean data are summarized in Table 2.
Figure 4
Figure 4. Individual components of the TT network are profoundly remodeled during HF development
A, Representative TT network grayscale images from sham, 4pMI, and 8pMI cardiomyocytes show STED raw data, overlay of skeleton data, and extracted intact skeleton network data after automated thresholding. In addition, superenlarged TT cross sections were manually evaluated (8pMI: yellow asterisks; see also Results section). Scale bars (green) indicate 2 µm and longitudinal (0°) orientation. B, Probability histograms of individual (relative) orientations of network components for sham, 4pMI, and 8pMI groups. Dashed lines represent Gauss fits. The majority of network components correspond either to longitudinal (0°) or transversal (90°) orientations (marked by red dotted lines). C, Difference integrals showing changes between indicated treatment groups. For instance, the difference integral between 4pMI and sham (left, 4pMI-sham) shows a relative increase in longitudinal (0°) and a decrease in transversal (90°) component orientations during early HF development. D, Bar graphs summarizing average amount of TT network components for sham, 4pMI, and 8pMI data. Left, Total network length normalized to cell area. Center, Total component lengths normalized to cell area, each for longitudinal (0°), transversal (90°), and oblique (±45°) orientations. Right, Number of triple junctions composed of 3 individual components normalized to cell area. *P<0.05 versus sham; n.s. indicates not significant.
Figure 5
Figure 5. Remodeling of TT-associated nanodomains, Ca2+ release dyssynchrony, and protein expression in early HF (4pMI)
A, top, Sham cardiomyocytes show differences in Cav3 versus Jph2 colocalization with RyR2 clusters as evidenced by color separation of punctate Cav3 and RyR2 signals at striations (para-localization), whereas Jph2 and RyR2 are fully colocalized (yellow puncta). Note Cav3 signal (red) rarely occurs between striations. Dotted rectangles correspond to magnification. Lower left, 4pMI cardiomyocytes show changes both of Cav3 and RyR2 signals, including an increase of longitudinal Cav3-positive structures. Lower right, 8pMI cardiomyocytes showed decreased Jph2 signals compared to RyR2. An increased spatial variability with a loss of striation associated signals after MI compared with sham was confirmed by Fourier analysis, summarized in Online Figure VII. B, left, STED image of neighboring TT cross sections, only the right TT shows a membrane evagination; right, rotated 3D reconstruction of the same TTs reveals abrupt change in morphology of the right TT. Triangle indicates position of leftward imaging plane; scale, 200 nm; see Online Figure VI for extended data. C, Simultaneous imaging of Ca2+ and TT signals by transversal line scans of sham and 4pMI cardiomyocytes. Ca2+ release synchrony was quantified by half-maximal thresholding (F50) and temporal variability analysis (leading edge behavior) similar to Louch et al. The dyssynchrony index is 2.2 ms for sham and 15.6 ms for 4pMI. For average dyssynchrony indexes of transversal and longitudinal scans, see Results section. D, RyR2, Jph2, and Cav3 immunoblots from cardiomyocytes isolated from sham, 4pMI, and 8pMI hearts as indicated. Bar graphs summarize change in protein expression normalized to sham from at least 3 independent measurements; *P<0.05 versus sham; n.s. indicates not significant.
Figure 6
Figure 6. Computational modeling of local CRU Ca2+ release in HF and during increased TT spacing of RyR2 clusters
Local [Ca2+]i signals from 20 000 CRUs were modeled for 15 seconds starting from the same initial conditions to reach steady-state Ca2+ transients at 1 Hz pacing. A, Action potential (AP) under normal control conditions (black); HF (red); HF with 25% orphaned RyR2 clusters (blue) resulting in AP prolongation; and orphaning without HF (green). B, The cell-wide cytosolic [Ca2+]i transient is delayed in HF (red), and RyR2 orphaning causes further, even biphasic prolongation (blue). C, In HF, SR Ca2+ content is decreased throughout E-C coupling (red). However, HF with RyR2 orphaning restores diastolic SR Ca2+ load (blue); orphaning without HF (green). D, L-type Ca2+ current (LCC) inactivation is delayed in HF (red) and further delayed by RyR2 orphaning (blue). E, Total peak RyR2 Ca2+ flux is decreased in orphaning without HF (green), HF without (red) and with RyR2 orphaning (blue) including abnormally delayed RyR2 Ca2+ flux causing a second Ca2+ flux peak in diastole. E, inset, During late diastole (after 15.2 seconds) RyR2 Ca2+ flux (leak) from Ca2+ sparks is increased in HF (red) compared with control (black). RyR2 orphaning further increases leak through Ca2+ sparks (blue). F, Integrated RyR2 Ca2+ flux during systole and diastole. Early RyR2 Ca2+ flux during systole (15.01–15.06 seconds) is decreased in HF and further decreased with RyR2 orphaning. During diastolic AP repolarization (15.06 –15.21 seconds) late RyR2 Ca2+ flux is abnormally increased in HF and further increased by RyR2 orphaning, corresponding with AP prolongation in A. During the diastolic AP phase 4 (15.21–15.50 seconds), RyR2 Ca2+ leak is increased in HF (red) and worsened by additional RyR2 orphaning (blue). Note: diastolic RyR2 Ca2+ leak corresponds to increased Ca2+ spark frequency and duration in E, inset.

References

    1. Endo M. Entry of a dye into the sarcotubular system of muscle. Nature. 1964;202:1115–1116. - PubMed
    1. Bu G, Adams H, Berbari EJ, Rubart M. Uniform action potential repolarization within the sarcolemma of in situ ventricular cardiomyocytes. Biophys J. 2009;96:2532–2546. - PMC - PubMed
    1. Song LS, Sobie EA, McCulle S, Lederer WJ, Balke CW, Cheng H. Orphaned ryanodine receptors in the failing heart. Proc Natl Acad Sci U S A. 2006;103:4305–4310. - PMC - PubMed
    1. Franzini-Armstrong C, Protasi F, Ramesh V. Shape, size, and distribution of Ca(2+) release units and couplons in skeletal and cardiac muscles. Biophys J. 1999;77:1528–1539. - PMC - PubMed
    1. Hayashi T, Martone ME, Yu Z, Thor A, Doi M, Holst MJ, Ellisman MH, Hoshijima M. Three-dimensional electron microscopy reveals new details of membrane systems for Ca2+ signaling in the heart. J Cell Sci. 2009;122(Pt 7):1005–1013. - PMC - PubMed

Publication types

MeSH terms