

Do changes in sex steroid hormones precede or follow increases in body weight during the menopause transition? Results from the Study of Women's Health Across the Nation
- PMID: 22723312
- PMCID: PMC3431568
- DOI: 10.1210/jc.2012-1614
Do changes in sex steroid hormones precede or follow increases in body weight during the menopause transition? Results from the Study of Women's Health Across the Nation
Abstract
Context: Whether menopause-related changes in sex steroids account for midlife weight gain in women or whether weight drives changes in sex steroids remains unanswered.
Objective: The objective of the study was to characterize the potential reciprocal nature of the associations between sex hormones and their binding protein with waist circumference in midlife women.
Design, setting, and participants: The study included 1528 women (mean age 46 yr) with 9 yr of follow-up across the menopause transition from the observational Study of Women's Health Across the Nation.
Main outcome measures: Waist circumference, SHBG, testosterone, FSH, and estradiol were measured.
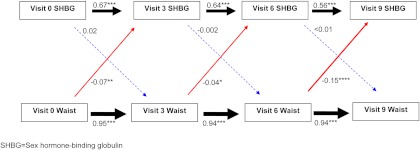
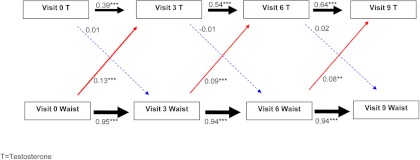
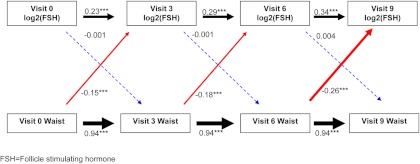
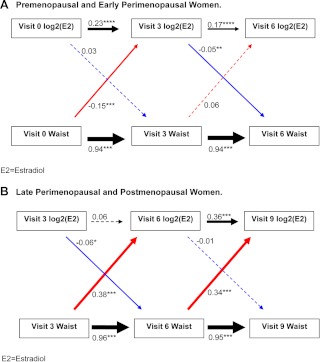
Results: Current waist circumference predicted future SHBG, testosterone, and FSH but not vice versa. For each SD higher current waist circumference, at the subsequent visit SHBG was lower by 0.04-0.15 SD, testosterone was higher by 0.08-0.13 SD, and log(2) FSH was lower by 0.15-0.26 SD. Estradiol results were distinct from those above, changing direction across the menopause transition. Estradiol and waist circumference were negatively associated in early menopausal transition stages and positively associated in later transition stages (for each SD higher current waist circumference, future estradiol was lower by 0.15 SD in pre- and early perimenopause and higher by 0.38 SD in late peri- and postmenopause; P for interaction <0.001). In addition, they appeared to be reciprocal, with current waist circumference associated with future estradiol and current estradiol associated with future waist circumference. However, associations in the direction of current waist circumference predicting future estradiol levels were of considerably larger magnitude than the reverse.
Conclusions: These Study of Women's Health Across the Nation data suggest that the predominant temporal sequence is that weight gain leads to changes in sex steroids rather than vice versa.
Figures
Comment in
-
Climacteric commentaries.Climacteric. 2013 Apr;16(2):293-302. doi: 10.3109/13697137.2013.769834. Climacteric. 2013. PMID: 23488526 No abstract available.
References
-
- Wildman RP, Sowers MR. 2011. Adiposity and the menopausal transition. Obstet Gynceol Clin North Am 38:441–454 - PubMed
-
- Sowers MR. 2000. SWAN: a multicenter, multiethnic, community-based cohort study of women and the menopause transition. In: Lobo RA, Kelsey J, Marcus J, eds. Menopause: biology and pathobiology. San Diego: Academic Press; 175–188
-
- Block G, Thompson FE, Hartman AM, Larkin FA, Guire KE. 1992. Comparison of two dietary questionnaires validated against multiple dietary records collected during a 1-year period. J Am Diet Assoc 92:686–693 - PubMed
-
- Zeger SL, Liang KY, Albert PS. 1988. Models for longitudinal data: a generalized estimating equation approach. Biometrics 44:1049–1060 - PubMed
-
- Bentler PM. 1990. Comparative fit indexes in structural models. Psycholog Bull 107:238–246 - PubMed
Publication types
MeSH terms
Substances
Grants and funding
- AG012553/AG/NIA NIH HHS/United States
- AG012554/AG/NIA NIH HHS/United States
- AG012539/AG/NIA NIH HHS/United States
- AG012531/AG/NIA NIH HHS/United States
- U01 AG012495/AG/NIA NIH HHS/United States
- U01 AG012505/AG/NIA NIH HHS/United States
- AG012535/AG/NIA NIH HHS/United States
- AG012546/AG/NIA NIH HHS/United States
- NR004061/NR/NINR NIH HHS/United States
- U01 AG012554/AG/NIA NIH HHS/United States
- U01 AG012535/AG/NIA NIH HHS/United States
- U01 AG012553/AG/NIA NIH HHS/United States
- U01 NR004061/NR/NINR NIH HHS/United States
- U01 AG012539/AG/NIA NIH HHS/United States
- AG012495/AG/NIA NIH HHS/United States
- U01 AG012546/AG/NIA NIH HHS/United States
- U01 AG012531/AG/NIA NIH HHS/United States
- AG012505/AG/NIA NIH HHS/United States
LinkOut - more resources
Full Text Sources
Medical
Miscellaneous
