. 2012 Sep;60(9):638-57.
doi: 10.1369/0022155412452417. Epub 2012 Jun 21.

A contemporary atlas of the mouse diaphragm: myogenicity, vascularity, and the Pax3 connection

Affiliations

A contemporary atlas of the mouse diaphragm: myogenicity, vascularity, and the Pax3 connection

Pascal Stuelsatz et al. J Histochem Cytochem. 2012 Sep.

Abstract

The thoracic diaphragm is a unique skeletal muscle composed of costal, crural, and central tendon domains. Although commonly described in medical textbooks, newer insights into the diaphragm cell composition are scarce. Here, using reporter mice, combined with gene expression analyses of whole tissues and primary cultures, we compared the diaphragm domains and their myogenic progenitors (i.e., Pax3/7 satellite cells). The outcomes of these analyses underscore the similarities between the myogenic aspects of the costal and crural domains. Expression levels of all myogenic genes examined (except Pax3) were strongly affected in mdx (dystrophin-null) mice and accompanied by an increase in fibrosis- and adiposity-related gene expression. Cell culture studies further indicated the presence of a non-myogenic Pax3-expressing population, potentially related to vascular mural cells. We additionally investigated the diaphragm vasculature. XLacZ4 and Sca1-GFP transgenes allowed a fine definition of the arterial and microvasculature network based on reporter expression in mural cells and capillary endothelium, respectively. We also provide insights into the organization of the diaphragm venous system, especially apparent in the central tendon and exhibiting arcades lined with fat-containing cells. The novel information in this "contemporary atlas" can be further explored in the context of diaphragm pathology and genetic disorders.


Conflict of interest statement

Declaration of Conflicting Interests: The authors declared no potential conflicts of interest with respect to the research, authorship, and/or publication of this article.

Figures

Figure 1.
Figure 1.
Abdominal view of isolated mouse diaphragm (A) along with a schematic view of the diaphragm muscle and tendon domains (B). Here and in all subsequent figures: (i) blue, red, and orange dotted circles indicate the apertures for the inferior vena cava (v), aorta (a), and esophagus (e), respectively; (ii) left or right location of the inferior vena cava in diaphragm images reflects abdominal or thoracic view of the diaphragm, respectively. An array of channel-like structures can be seen within the central tendon, which is part of the venous drainage system of the diaphragm and is discussed later. Scale bar, 5 mm (A).
Figure 2.
Figure 2.
Skeletal muscle–related reporters identify features of the diaphragm domains, viewed by direct fluorescence (A–B) or following X-gal staining (C–E). (A, A′) MyoDiCre-driven GFP expression identifies myofibers (and their satellite cells), while the interstitial non-myogenic cells are distinguished based on red fluorescence. (A′) White arrowheads indicate the phrenic nerves. (A′′) Higher magnification is needed to observe the faint red fluorescence of the central tendon. (B) The cellular nature of the central tendon is confirmed by DAPI counterstaining. (C) a7integrin-driven LacZ expression identifies the myofibers (and satellite cells), as well as the phrenic arteries (red arrowheads). The venous drainage system is seen in the central tendon (discussed later). (C′) Higher-magnification view showing interdigitations of myofibers at the myotendinous junction (MTJ). (D, E) MLC3F-nLacZ and Myf5nLacZ reporters, expressed by myofiber nuclei and satellite cells, respectively. Additional details about Myf5nLacZ reporter expression in satellite cells are presented in Supplemental Fig. S1. (D, E) Round cells seen at the periphery of the central tendon are perivascular fat cells that line the venous arcade, a portion of which is shown in panel E. Scale bars, 5 mm (A, A′, C), 100 µm (C′, D, E).
Figure 3.
Figure 3.
Identification of the major arterial networks and their schematic representation (A–C) as well as the description of the capillary system with associated pericytes (D–F) in diaphragms from XLacZ4 or XLacZ4/Sca1-GFP reporter mice. The XLacZ4 transgene expresses β-gal reporter in nuclei of mural cells (vascular smooth muscle cells and pericytes) and the Sca1-GFP transgene identifies the capillary endothelium. All images were obtained following X-gal staining. (D, D′ and E, E′) Paired fluorescent and phase images of costal and crural muscle domains, depicting the dense capillary network (GFP+, panels D, E) and arterial trees (X-gal+, D, D′ and E, E′), as well as the presence of numerous solitary XLacZ4+ pericytes (X-gal+, panels D′, E′) that are more obvious in the higher-magnification views (D′′, E′′). (F) A higher-magnification fluorescent image showing capillaries (GFP+) with associated solitary pericytes (black dots) in costal muscle. White arrowheads point to pericytes in close proximity with capillary endothelium, while orange arrowheads identify anastomoses between capillaries running parallel to the myofibers. Notably, perivascular fat can be seen associated with the venous arcade in panel D′ and with the artery in panel E′′ (further discussed in Fig. 4). Scale bars, 1 mm (A, B, D, D′, E, E′), 100 µm (D′′, E′′), 50 µm (F).
Figure 4.
Figure 4.
Identification of the major venous drainage system in diaphragms from XLacZ4 mice as viewed directly after isolation (A, B, G′) or following X-gal staining combined with Oil-red-O staining (C, D) or X-gal staining by itself (E–G). (A) In this thoracic view, the left and right phrenic veins form a clearly distinguishable arcade on each side of the central tendon; these arcades join (black dotted lines) and drain into the inferior vena cava. (B–D) Details of the venous arcade (abdominal views). (B) Blue arrowheads point to multiple tributaries coming from the costal muscle domain and joining the main phrenic vein. (C, D) Lower- and higher-magnification images of Oil-red-O staining, which reveal the presence of perivascular fat cells along the venous arcade. (E, F) Abdominal and thoracic views, respectively, of the left dorsal region of the diaphragm depicting the crural and costal muscle venous drainage; blue arrowheads point to tributaries coming from the muscle domains and draining into the venous arcade. In panels A, E, and F, the magenta arrows point to the same vein. (G) Details of the venous network inside the costal muscle (abdominal view); the venous system displays a distinctive pattern of scattered XLacZ4+ cells, while the arterial supply is detected in this image based on strong X-gal staining. Arrows: cyan arrow indicates a large tributary of the right phrenic vein; red arrow indicates a ramification of the left phrenic artery; and the yellow arrow indicates the phrenic nerve. (G′) A lower-magnification image indicating the localization of the field shown in panel G. Arrows inside the framed field and in the contralateral side in panel G′ point to vascular and nerve structures according to the color scheme in panel G. Scale bars, 2 mm (G′), 1 mm (A, B), 500 µm (C, E, F, G), 100 µm (D).
Figure 5.
Figure 5.
Comparison of gene expression signatures across the muscle and tendon domains of diaphragms from wildtype versus mdx mice. To ensure that the mdx diaphragm exhibited signs of advanced dystrophy, all mice used in this study were 12–14 months old. (A) A representative semi-quantitative RT-PCR analysis of the costal muscle (CoM), crural muscle (CrM), and central tendon (CT) domains for expression levels of muscle-related genes (Pax3, Pax7, myogenin, MRF4, myostatin) and additional genes relevant to fibrosis and adiposity (TGF-β1, Col1-α1, ADAM12, adipsin, β-klotho). Expression of TBP and 18S served as quality and loading controls. The number of PCR cycles is indicated per each gene at the right side. For each experiment (n=4), two littermate mice were used in parallel for each preparation the costal and crural muscles were processed and analyzed individually per each mouse, but the central tendon was pooled from two mice due to the reduced amount of tissue recovered from this domain. (B) Oil-red-O-stained diaphragms from wildtype and mdx mice are shown with detected fat deposits, in parallel with the gene expression analysis. The higher-magnification images of costal muscle depict channels of intramuscular fat that are prevalent in the mdx muscle. Scale bars, 5 mm (B, whole diaphragm panels), 1 mm (B, costal muscle panels).
Figure 6.
Figure 6.
Morphology and gene expression signatures of cultured cells isolated from diaphragm domains. In this analysis, in addition to the three domains detailed in Fig. 5, we analyzed the transitional zone (TZ), a narrow strip carefully isolated at the muscle–tendon borders of both muscle domains. (A) Representative images of day 8 cultures from CoM, CrM, TZ, and CT domains. In addition to myogenic cells that fuse into myotubes, the domain cultures exhibited a range of other cell types, as discussed in the Results section. Scale bars, 50 µm. (B–D) Semi-quantitative RT-PCR analyses of: (B) day 5 and 10 cultures from the diaphragm domains; (C) control day 7 cultures of pure myogenic cells obtained from isolated extensor digitorum longus (EDL) and diaphragm (DIA) myofibers (each RNA preparation was established from 13 myofiber cultures harvested together); (D) whole EDL and diaphragm (DIA) tissues. TBP expression served as a quality and loading control. Numbers on the right side of panels B–D indicate the number of PCR cycles.
Figure 7.
Figure 7.
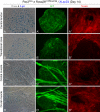
Identification of cell populations expressing Pax3Cre-driven GFP in live diaphragm domain cultures. (A–D′) Representative images of day 14 cultures prepared from the crural muscle and central tendon domains of Pax3Cre x Rosa26mT/flox/mG mouse. In addition to myotubes that were found to be GFP+ as anticipated, non-myogenic cells growing as nodules were also GFP+, whereas all other kinds of non-myogenic cells were Tomato+. (E–F′′) Representative day 21 control cultures prepared from (E) the transitional zone domain of MLC3F-nLacZ mouse (fixed culture for X-gal staining) and (F–F′′) the costal muscle domain of MyoDiCre x Rosa26mT/flox/mG mouse (live culture); LacZ and MyoDiCre-driven GFP expressions are restricted to myogenic cells. Scale bars, 50 µm (A–F′′).
Figure 8.
Figure 8.
Characterization of the nodules in diaphragm domain cultures by dual expression of Pax3Cre-driven GFP and the XLacZ4 transgene. Cultures of the four diaphragm domains were prepared from a Pax3Cre x Rosa26mT/flox/mG x XLacZ4 mouse. (A–D′′) Representative paired fluorescent and phase images of nodules from the four domain cultures after fixation in 2% paraformaldehyde and staining with X-gal at day 14. The apparent double fluorescent reporter expression at the periphery of the nodules is not within the same cells and is due to outgrowth of the enlarging nodules over Tomato+ cells and/or growth of Tomato+ cells under the nodules. Scale bars, 50 µm (A–D′′).

References

    1. Abu-Hijleh MF, Habbal OA, Moqattash ST. 1995. The role of the diaphragm in lymphatic absorption from the peritoneal cavity. J Anat. 186:453–467 - PMC - PubMed
    1. Acharya A, Baek ST, Banfi S, Eskiocak B, Tallquist MD. 2011. Efficient inducible Cre-mediated recombination in Tcf21 cell lineages in the heart and kidney. Genesis. 49:870–877 - PMC - PubMed
    1. Anderson JE, Garrett K, Moor A, McIntosh L, Penner K. 1998. Dystrophy and myogenesis in mdx diaphragm muscle. Muscle Nerve. 21:1153–1165 - PubMed
    1. Anraku M, Shargall Y. 2009. Surgical conditions of the diaphragm: anatomy and physiology. Thorac Surg Clin. 19:419–429 - PubMed
    1. Armulik A, Genove G, Betsholtz C. 2011. Pericytes: developmental, physiological, and pathological perspectives, problems, and promises. Dev Cell. 21:193–215 - PubMed

Publication types

MeSH terms