. 2012 Aug 9;120(6):1290-8.
doi: 10.1182/blood-2012-01-404699. Epub 2012 Jun 21.

Overexpression of IL-1 receptor accessory protein in stem and progenitor cells and outcome correlation in AML and MDS

Affiliations

Overexpression of IL-1 receptor accessory protein in stem and progenitor cells and outcome correlation in AML and MDS

Laura Barreyro et al. Blood. .

Abstract

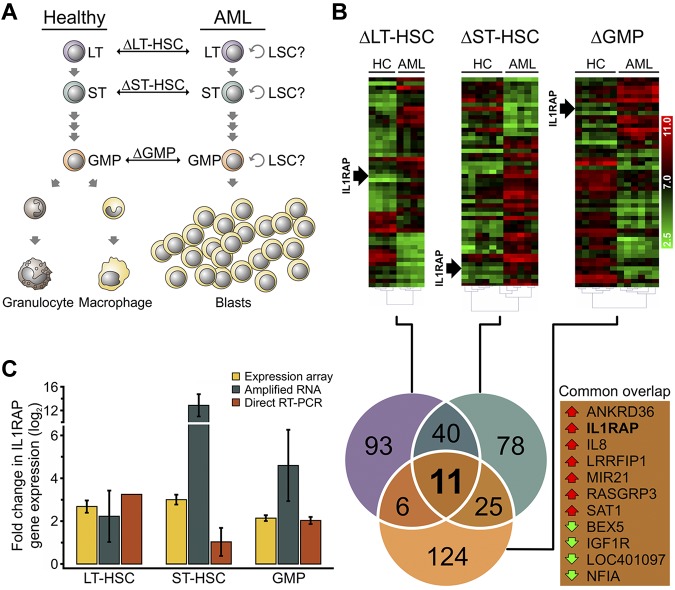
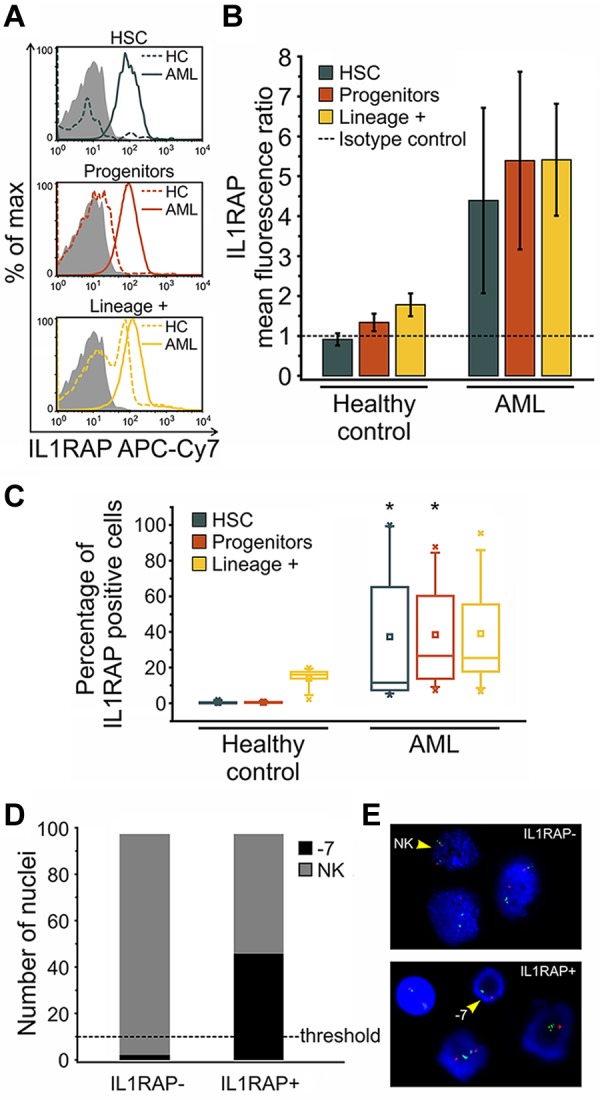
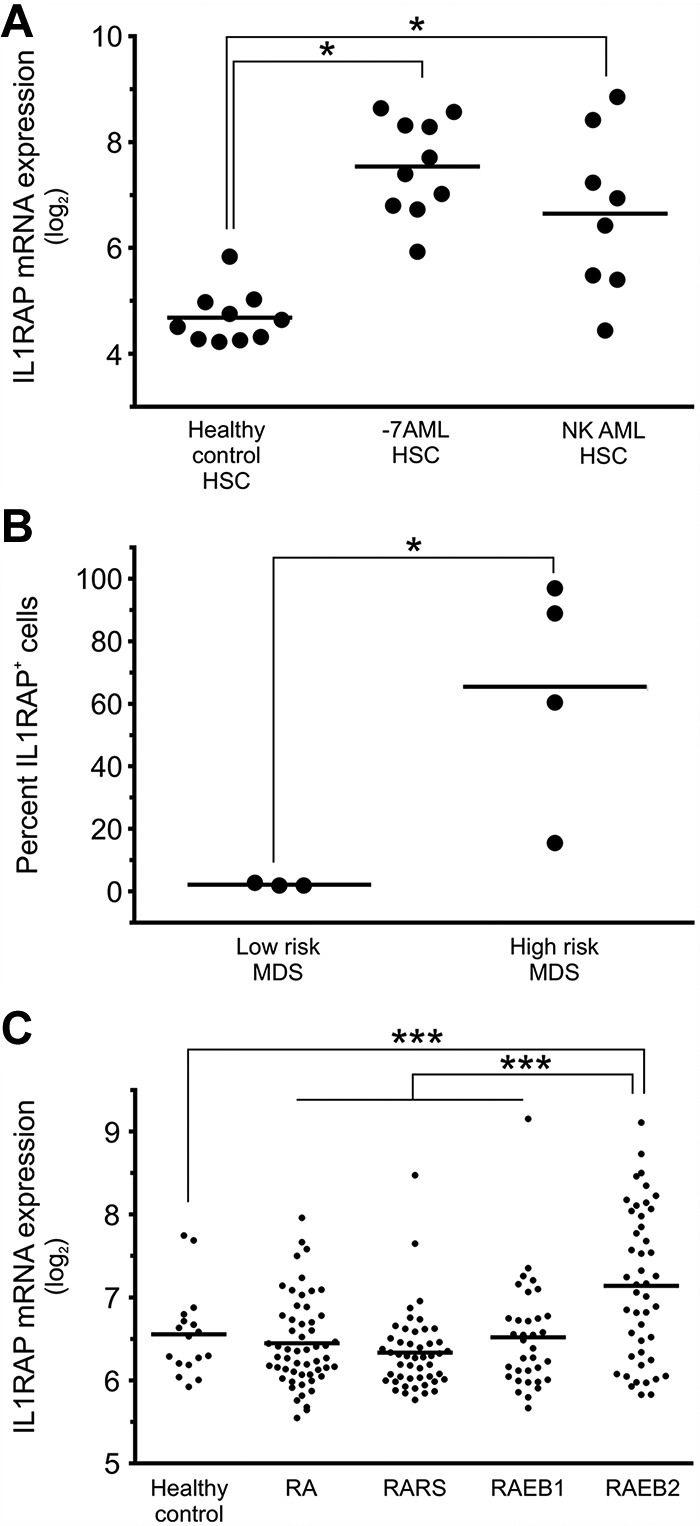
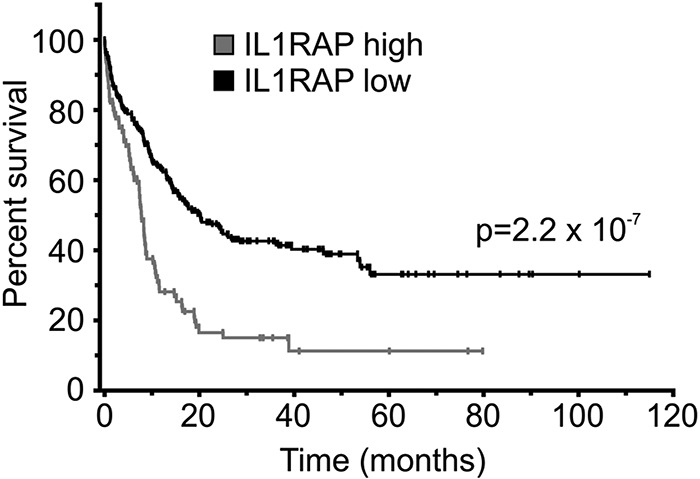
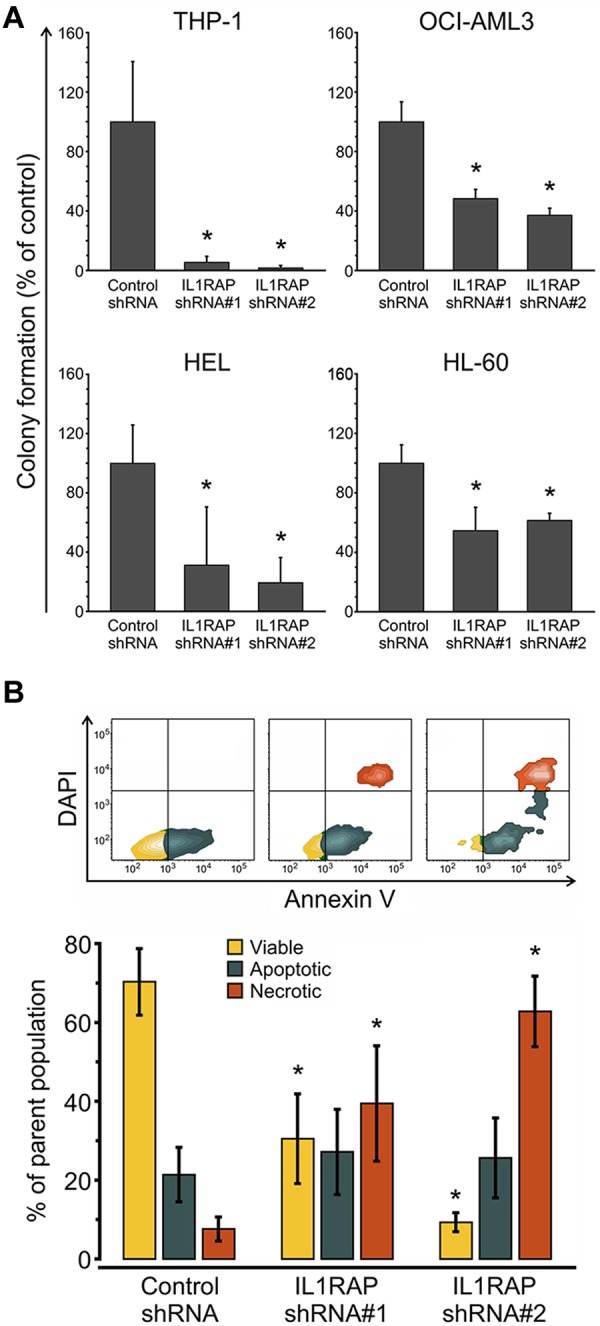
Cellular and interpatient heterogeneity and the involvement of different stem and progenitor compartments in leukemogenesis are challenges for the identification of common pathways contributing to the initiation and maintenance of acute myeloid leukemia (AML). Here we used a strategy of parallel transcriptional analysis of phenotypic long-term hematopoietic stem cells (HSCs), short-term HSCs, and granulocyte-monocyte progenitors from individuals with high-risk (-7/7q-) AML and compared them with the corresponding cell populations from healthy controls. This analysis revealed dysregulated expression of 11 genes, including IL-1 receptor accessory protein (IL1RAP), in all leukemic stem and progenitor cell compartments. IL1RAP protein was found to be overexpressed on the surface of HSCs of AML patients, and marked cells with the -7/7q- anomaly. IL1RAP was also overexpressed on HSCs of patients with normal karyotype AML and high-risk myelodysplastic syndrome, suggesting a pervasive role in different disease subtypes. High IL1RAP expression was independently associated with poor overall survival in 3 independent cohorts of AML patients (P = 2.2 × 10(-7)). Knockdown of IL1RAP decreased clonogenicity and increased cell death of AML cells. Our study identified genes dysregulated in stem and progenitor cells in -7/7q- AML, and suggests that IL1RAP may be a promising therapeutic and prognostic target in AML and high-risk myelodysplastic syndrome.


Figures

Figure 1
Figure 1
Transcriptional profiling of phenotypic hematopoietic stem and progenitor compartments of AML patients with monosomy 7 identifies overexpression of IL1RAP. (A) Schematic showing the cell types used for pairwise comparison of gene expression. Phenotypically defined hematopoietic stem and progenitor compartments with potential LSC activity were sorted and compared between healthy and AML individuals. The symbol “Δ” refers to the gene expression differences between groups in each phenotypically defined compartment: LT-HSCs, ST-HSCs, and GMPs. (B) Hierarchical clustering of the 50 most significantly dysregulated genes in −7 AML in phenotypically defined LT-HSCs, ST-HSCs, and GMPs of AML patients compared with HC. Heat maps of log2-transformed gene expression levels are shown (top). Position of IL1RAP is indicated. Venn diagram (bottom) shows the number of differentially expressed genes that are shared between, or restricted to, specific compartments between AML samples and HC. The numbers represent the total of up- or down-regulated genes in each pairwise comparison. Genes in the triple intersection (common overlap) are listed. Red and green arrows indicate overexpression and down-regulation in the AML samples, respectively. (C) Validation of IL1RAP mRNA expression in LT-HSCs, ST-HSCs, and GMPs. Yellow bars represent expression levels in the gene expression array (n = 4 for LT-HSCs, n = 5 for ST-HSCs, and n = 6 for GMPs). Blue bars represent mRNA levels determined by quantitative RT-PCR in amplified RNA (n = 2). Red bars represent the mRNA levels measured by quantitative RT-PCR from unamplified cDNA (n = 1 for LT-HSCs and n = 2 for ST-HSCs and GMPs). mRNA levels were normalized to GAPDH. Fold change compared with HC is shown.
Figure 2
Figure 2
IL1RAP protein is aberrantly expressed on distinct stem and progenitor cell compartments of AML patients with −7/7q−. Detection of IL1RAP expression at the protein level by flow cytometry in bone marrow-derived cells from HCs (n = 5) and AML patients with −7/7q− (n = 8). (A) Representative histograms show the distribution of IL1RAP protein (cell surface) expression (fluorescence intensity) within phenotypically defined cell compartments of HC (dotted line) and AML (solid line) samples measured using IL1RAP antibody. Gray histograms correspond to the isotype control. (B) Ratios of IL1RAP geometric mean fluorescence intensity relative to the isotype control (arbitrary unit = 1, indicated by the dotted line) for HSCs in blue, progenitors in red, and lineage-positive cells in yellow. Error bars represent SD. (C) Box-and-whisker plots represent the percentage of IL1RAP-positive cells in each cellular compartment, phenotypic HSCs in blue, progenitors in red, and lineage-positive cells in yellow, in HC and AML bone marrow. An isotype control was used to define positive expression in each experiment. The central box represents the values from the 25th to 75th percentile. The middle square represents the mean; and horizontal line, median. A line extends from the minimum to the maximum value. Black star indicates significant difference with HC counterparts. (D) FISH of sorted IL1RAP-positive and IL1RAP-negative cells of an AML patient bearing monosomy 7 hybridized with the Vysis LSI D7S486 (7q31) SpectrumOrange/CEP 7 SpectrumGreen Probe. Bar graph represents the number of nuclei with normal karyotype (NK) and monosomy 7 (−7) for each group (n = 100 nuclei analyzed per group). P < .001 (χ2). The scoring threshold is indicated. (E) Representative FISH image. The arrows indicate a NK FISH pattern with 2 individual green (centromere chromosome 7) and 2 orange (7q31) signals per nuclear section (top), and monosomy 7(−7) with 1 green and 1 orange signal (bottom), respectively.
Figure 3
Figure 3
IL1RAP is overexpressed on stem cells of patients with AML with monosomy 7, AML with normal karyotype, and high-risk MDS. (A) IL1RAP gene expression in phenotypically defined HSCs (LinCD34+CD38) in HCs (n = 10), AML with monosomy 7 (n = 10), and AML with normal karyotype (n = 8). *Differences compared with the HC group are statistically significant (P < .05 in both cases). (B) IL1RAP protein expression was determined in LinCD34+CD38 cells in MDS patients (n = 7: 3 with low-risk and 4 with high-risk MDS). An isotype control was used to define IL1RAP positivity in each experiment. Percentages of IL1RAP+ cells are shown. *P < .05. (C) IL1RAP mRNA expression in CD34+ cells of different types of MDS (n = 183 total) with refractory anemia (RA), refractory anemia with ringed sideroblasts (RARS), and refractory anemia with excess blast types 1 (RAEB1) and 2 (RAEB2), and CD34+ cells of HCs (n = 17). ***P < .001.
Figure 4
Figure 4
IL1RAP overexpression is associated with poor clinical outcome in AML with normal karyotype. Combined survival analysis of 3 cohorts of AML patients with normal karyotype (n = 317) dichotomized for IL1RAP gene expression levels at the 75th percentile. Overall survival of patients with low and high IL1RAP expression is shown in black and gray, respectively. Statistical significance is indicated.
Figure 5
Figure 5
IL1RAP knockdown decreases clonogenic potential and leads to increased cell death of AML cells. (A) Colony formation assays in semisolid methylcellulose media of AML cells (THP-1, OCI-AML3, HEL, and HL-60) infected with control and 2 IL1RAP-directed shRNAs. Data are mean ± SD. *P < .05. (B) Analysis of apoptosis/necrosis with annexin V/DAPI in THP-1 cells infected with control and IL1RAP shRNAs. Top panel: FACS contour plots of 1 representative experiment. Bottom panel: Mean ± SD of 3 independent experiments. *P < .05.

References

    1. Passegué E, Jamieson CH, Ailles LE, Weissman IL. Normal and leukemic hematopoiesis: are leukemias a stem cell disorder or a reacquisition of stem cell characteristics? Proc Natl Acad Sci U S A. 2003;100(Suppl 1):11842–11849. - PMC - PubMed
    1. Rosen JM, Jordan CT. The increasing complexity of the cancer stem cell paradigm. Science. 2009;324(5935):1670–1673. - PMC - PubMed
    1. Sarry JE, Murphy K, Perry R, et al. Human acute myelogenous leukemia stem cells are rare and heterogeneous when assayed in NOD/SCID/IL2Rgammac-deficient mice. J Clin Invest. 2011;121(1):384–395. - PMC - PubMed
    1. Majeti R, Chao MP, Alizadeh AA, et al. CD47 is an adverse prognostic factor and therapeutic antibody target on human acute myeloid leukemia stem cells. Cell. 2009;138(2):286–299. - PMC - PubMed
    1. Eppert K, Takenaka K, Lechman ER, et al. Stem cell gene expression programs influence clinical outcome in human leukemia. Nat Med. 2011;17(9):1086–1093. - PubMed

Publication types

MeSH terms

Substances