. 2012 Jun 19:3:213.
doi: 10.3389/fmicb.2012.00213. eCollection 2012.

Diversity and Distribution of Marine Synechococcus: Multiple Gene Phylogenies for Consensus Classification and Development of qPCR Assays for Sensitive Measurement of Clades in the Ocean

Affiliations

Diversity and Distribution of Marine Synechococcus: Multiple Gene Phylogenies for Consensus Classification and Development of qPCR Assays for Sensitive Measurement of Clades in the Ocean

Nathan A Ahlgren et al. Front Microbiol. .

Abstract

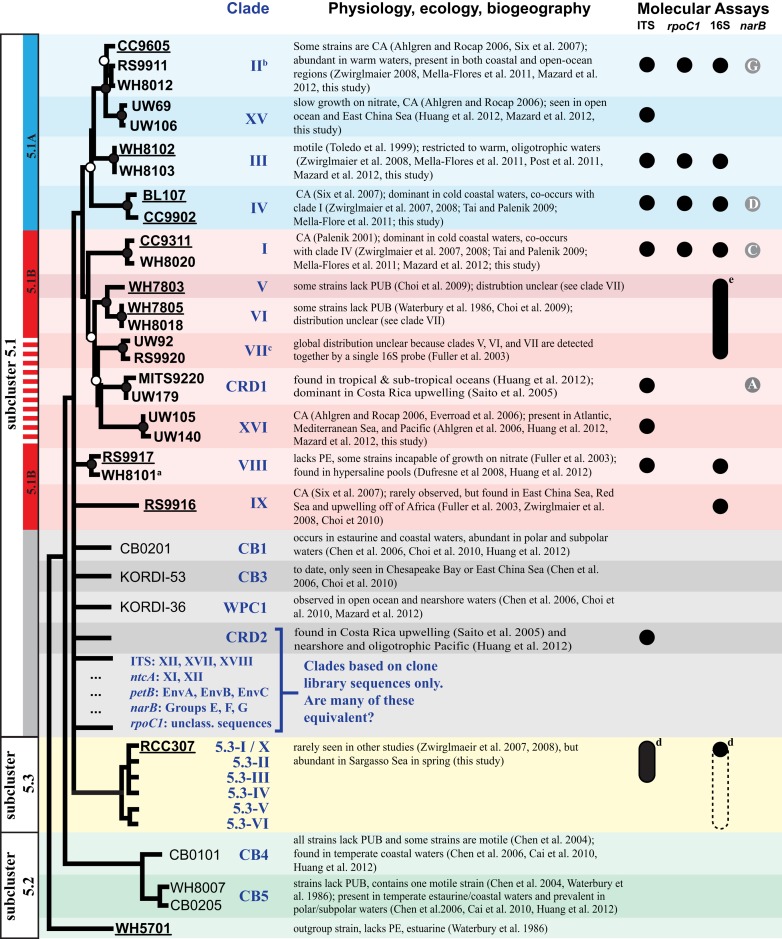
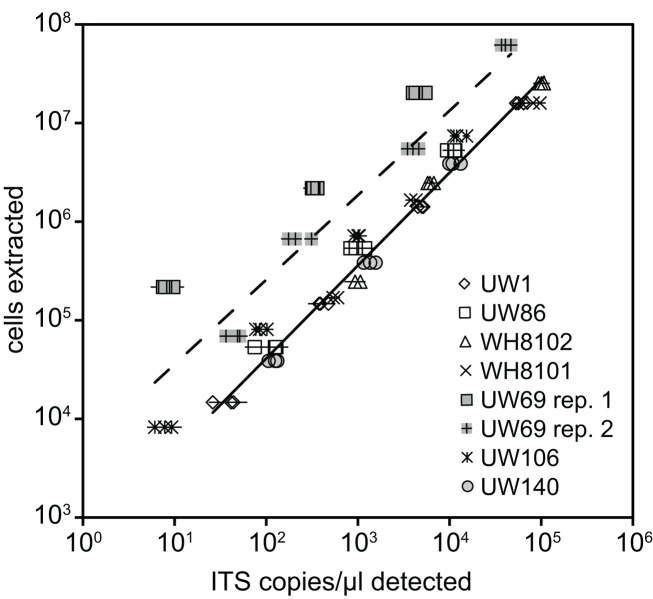
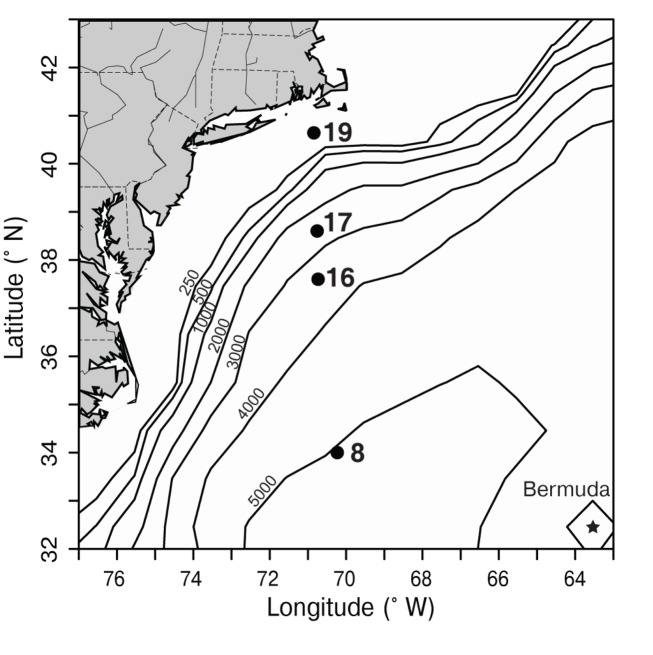
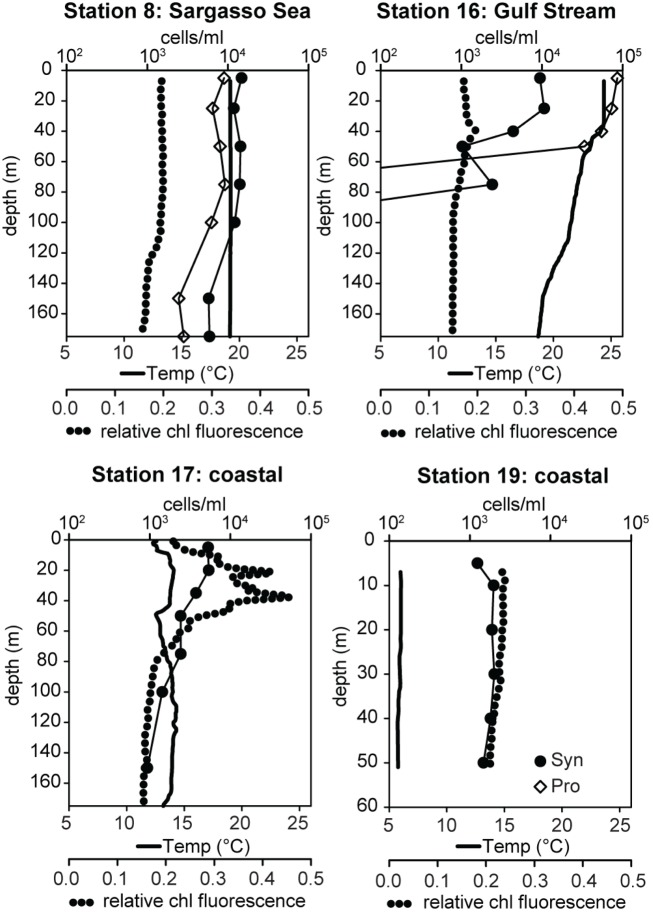
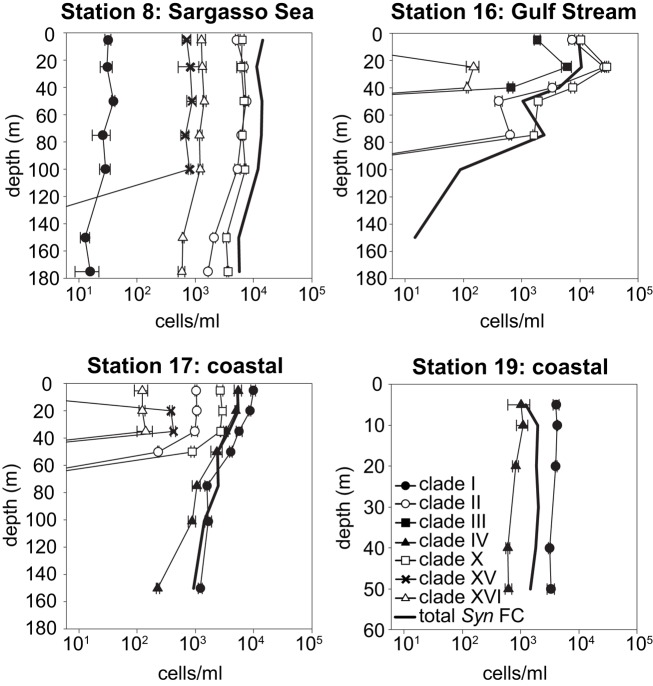
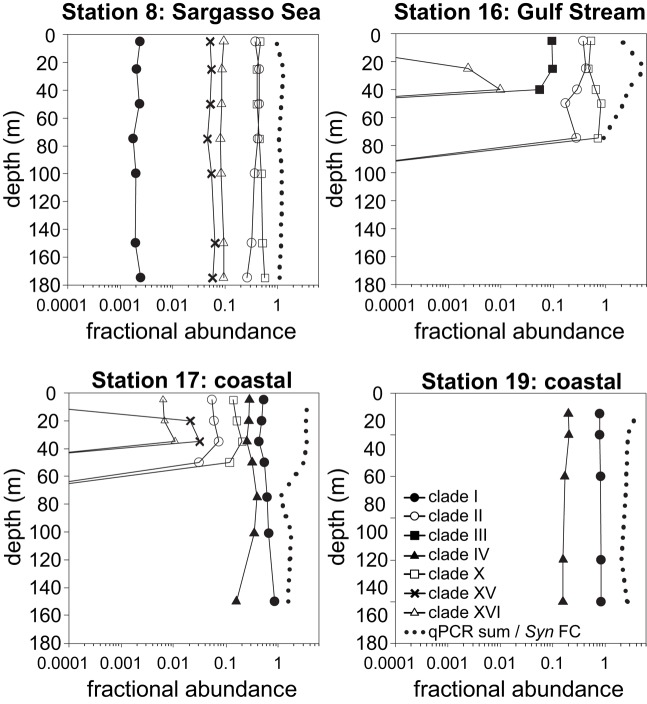
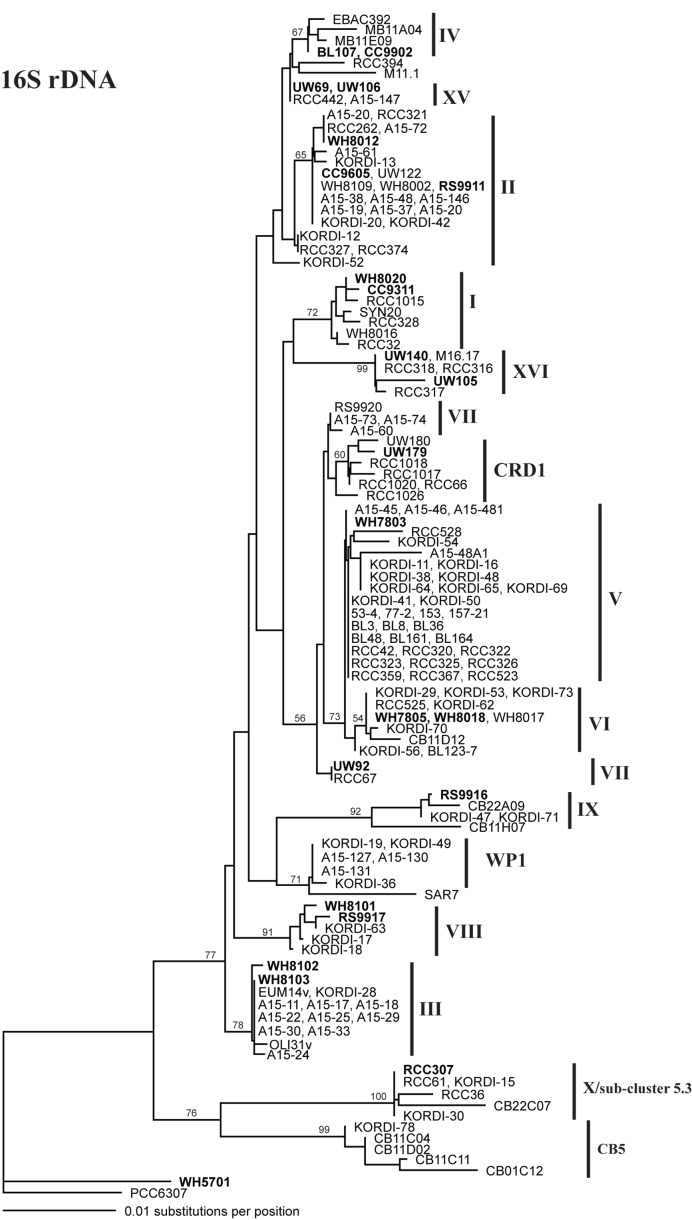
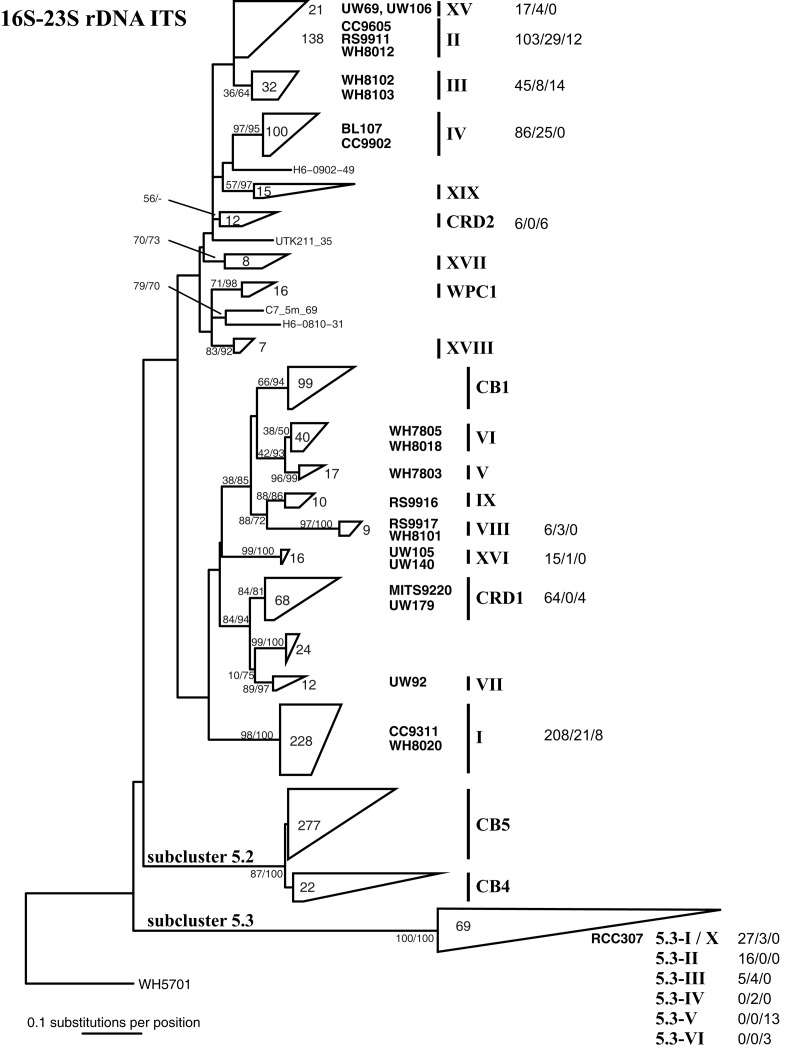
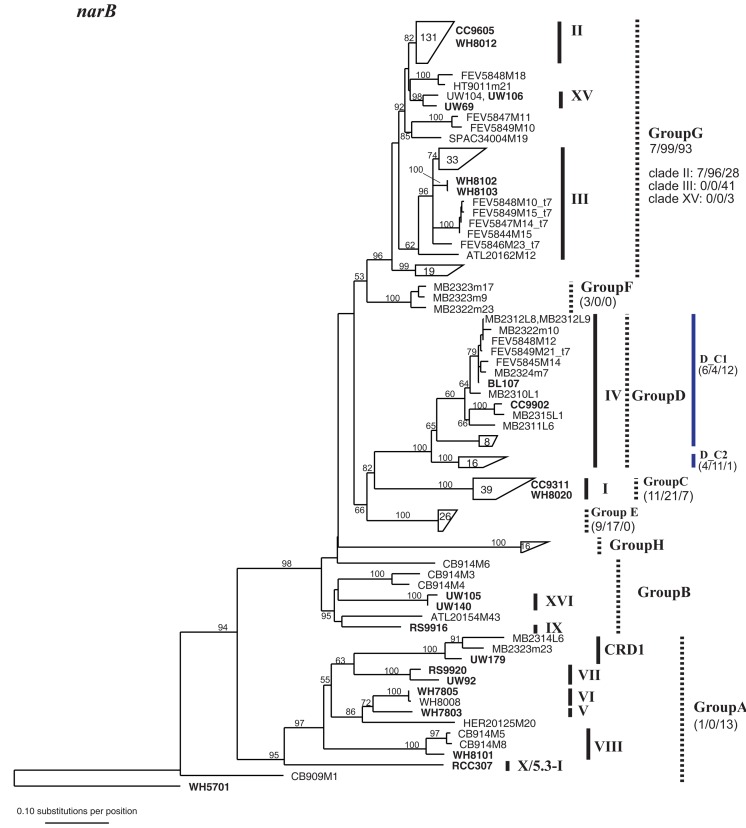
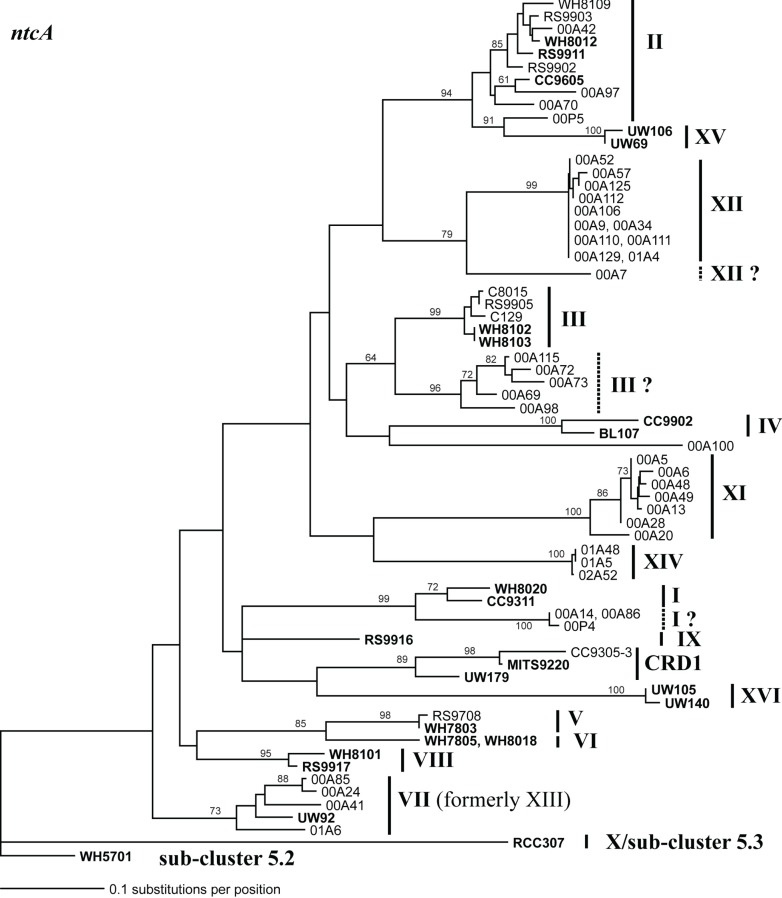
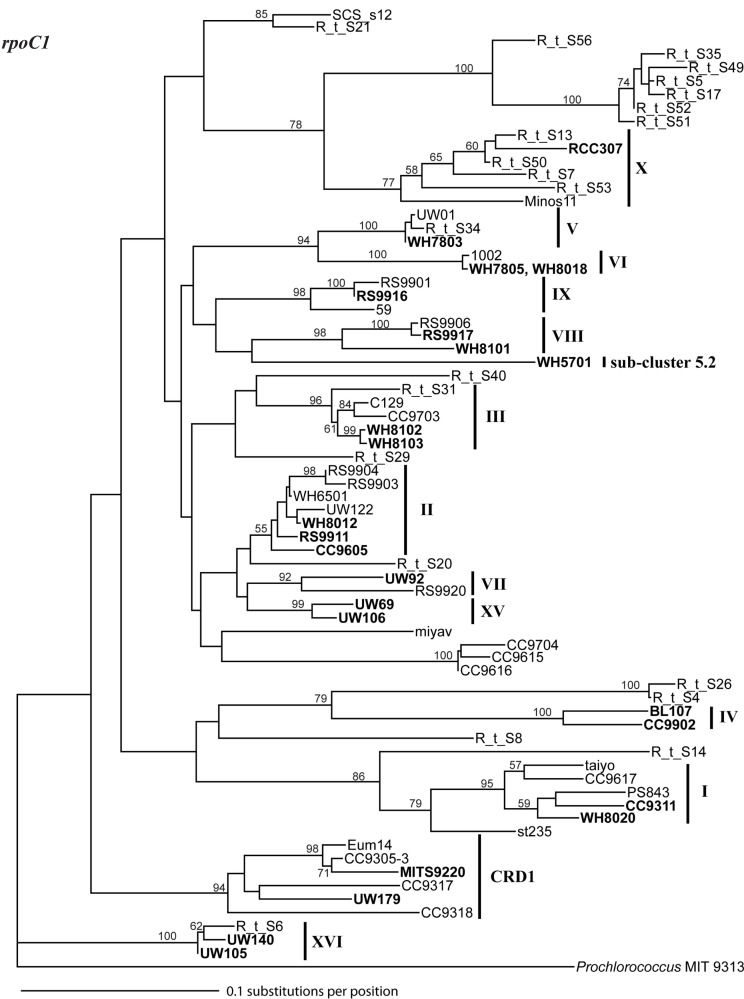
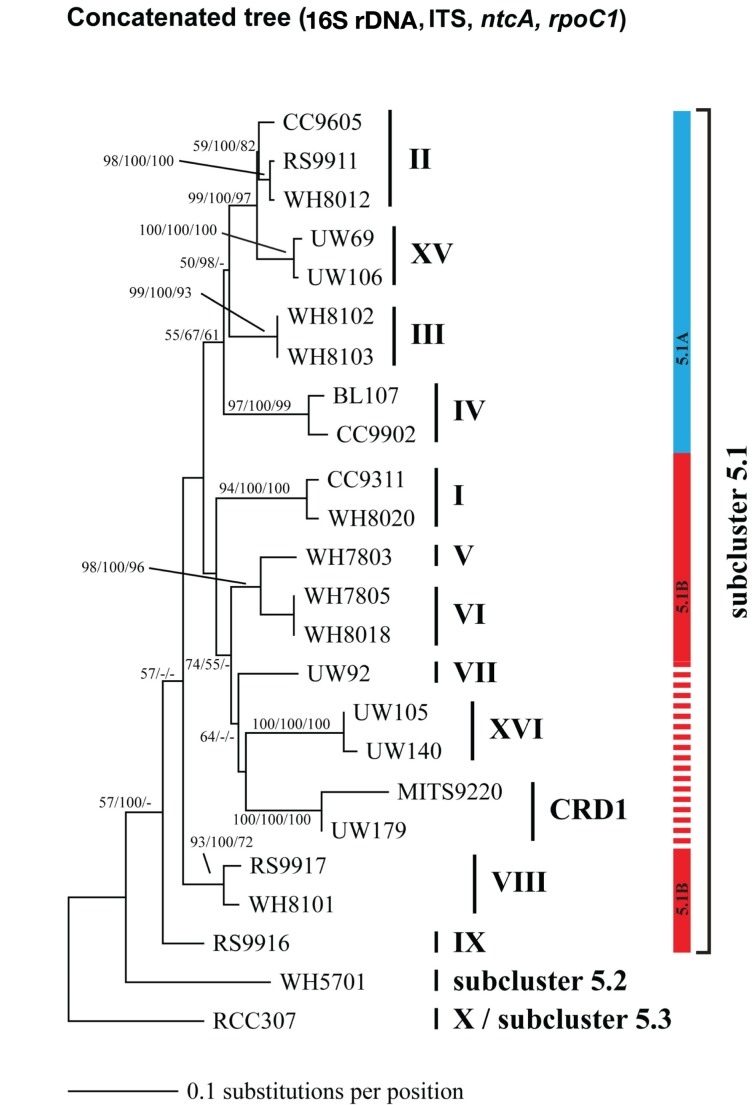
Marine Synechococcus is a globally significant genus of cyanobacteria that is comprised of multiple genetic lineages or clades. These clades are thought to represent ecologically distinct units, or ecotypes. Because multiple clades often co-occur together in the oceans, Synechococcus are ideal microbes to explore how closely related bacterial taxa within the same functional guild of organisms co-exist and partition marine habitats. Here we sequenced multiple gene loci from cultured strains to confirm the congruency of clade classifications between the 16S-23S rDNA internally transcribed spacer (ITS), 16S rDNA, narB, ntcA, and rpoC1 loci commonly used in Synechococcus diversity studies. We designed quantitative PCR (qPCR) assays that target the ITS for 10 Synechococcus clades, including four clades, XV, XVI, CRD1, and CRD2, not covered by previous assays employing other loci. Our new qPCR assays are very sensitive and specific, detecting down to tens of cells per ml. Application of these qPCR assays to field samples from the northwest Atlantic showed clear shifts in Synechococcus community composition across a coastal to open-ocean transect. Consistent with previous studies, clades I and IV dominated cold, coastal Synechococcus communities. Clades II and X were abundant at the two warmer, off-shore stations, and at all stations multiple Synechococcus clades co-occurred. qPCR assays developed here provide valuable tools to further explore the dynamics of microbial community structure and the mechanisms of co-existence.

Keywords: Synechococcus; biogeography; cyanobacteria; ecotype; microbial diversity; microbial ecology; multiple gene locus phylogeny; quantitative PCR.


Figures

Figure 1
Figure 1
Schematic phylogenetic tree summarizing the genetic and ecological diversity of marine Synechococcus and molecular assays that have been developed to measure particular clades in the oceans. The depicted tree is approximately based on a four loci concatenated tree (Figure A6 in Appendix). Examples of commonly studied strains (“type” strains) in each clade are shown. Strains in bold were selected for multiple gene loci analysis, and strains with sequenced genomes are underlined. Branch tips without taxa names indicate clades that are only represented by environmental sequences (e.g., clade CRD2). Nodes with bootstrap support of ≥55% are denoted with circles (closed circles indicate >75% support and open circles indicate 55–75% support). Polytomies indicate cases where the placement of clades is uncertain because of low bootstrap support or the absence of sequences available for multiple loci. Marine Synechococcus are classified into three subclusters 5.1, 5.2, and 5.3 (black vertical boxes on left), and phylogeny based on 1,129 core genes from 11 strains with sequenced genomes supports the division of strains in subcluster 5.1 into two groups 5.1A (blue bar) and 5.1B (solid red bar) (Dufresne et al., 2008). The four loci concatenated phylogeny in Figure A6 in Appendix also supports the grouping of 5.1A strains, including clade XV. Strains in clades VII, CRD1, and XVI cluster with 5.1B strains in clades V and VI with high bootstrap support, however it is still unknown if these additional new strains without sequenced genomes form a single monophyletic cluster with all 5.1B strains (dashed red line). Information about specific physiologies, ecology, or biogeography of clades is summarized with relevant references. Chromatic adaptation (CA) is the ability to shift the ratio of accessory pigments phycourobilin (PUB) and phycoerythrobilin (PEB) according to the spectral quality of light (Palenik, ; Six et al., 2007). Circles (or ovals, see footnotes) indicate clades for which quantitative molecular assays have been designed to measure their abundance in the environment. [ITS, this study; rpoC1 (Tai and Palenik, ; Tai et al., 2011); 16S rDNA (Fuller et al., 2003); narB (Paerl et al., 2011)]. narB sequences have been classified to groups “A” to “G” rather than the convention of clades used by other loci (Paerl et al., ; see Figure A3 in Appendix). Circles with letters indicate the clade(s) for which narB qPCR primers designed for that narB group have perfect matches to at least one of the sequences in the clade (see Figure A3 in Appendix for more info on primer coverage). aWH8101 was formerly classified as belonging to cluster 5.2 (Herdman et al., 2001), but this and other phylogenies suggest it belongs in cluster 5.1. bClade II includes clade WPC2 following the convention of Huang et al. (2012). cClade XIII is congruent with and has been subsumed into clade VII (see Figure A4 in Appendix). dITS qPCR primers were designed to perfectly match clade X strains, now classified as clade 5.3-I. These primers have perfect matches to sequences from 5.3-I through 5.3-III (but not 5.3-IV through 5.3-VI; see Figure A2 in Appendix). Similarly, the clade X 16S rDNA probe was designed before the discovery of clades 5.3-II–5.3-VI. Because there are no corresponding 16S rDNA sequences for clades 5.3-II–5.3-VI, it is unknown if the clade X probe detects these other subcluster 5.3 clades as indicated by the dashed oval. eThis 16S rDNA probe detects clades V, VI, VII together.
Figure 2
Figure 2
Calibration of qPCR assays. Known amounts of cells from cultures were filtered and extracted for various strains. Extracted cells were plotted against the concentration of ITS copies/μl detected with qPCR using plasmid standards. Triplicate filters were made and extracted for each concentration of cells tested. Points represent averages of quadruplicate qPCR reactions performed on each extraction, and error bars represent the standard deviation. Log–log regression lines are shown for all clade XV strains tested (dashed line, UW69 both replicate filter sets and UW106) and all remaining strains together (solid line).
Figure 3
Figure 3
Map depicting sampling locations (black dots) along a transect in the northwest Atlantic, south of Massachusetts in March 2002. Bathymetric contours (black lines, depth in m) are shown, and the location of Bermuda is marked with a star. Station 8 was located in the Sargasso Sea and station 16 was located in the Gulf Stream (based on satellite sea surface temperature, data not shown). Stations 17 and 19 represent coastal stations.
Figure 4
Figure 4
Water column properties of field samples and total Synechococcus (Syn, filled circles) and Prochlorococcus (Pro, open diamonds) concentrations determined by flow cytometry. Water temperature is depicted with solid lines and relative chlorophyll (chl) fluorescence with dotted lines.
Figure 5
Figure 5
Clade abundances determined by qPCR, and total Synechococcus concentrations determined by flow cytometry (FC). Error bars represent the standard deviation of triplicate qPCR reactions.
Figure 6
Figure 6
Relative abundances of Synechococcus clades and the ratio of summed abundances to total Synechococcus abundance determined by flow cytometry. Relative abundances of clades were calculated by dividing the abundance of each clade by the sum of all clades detected by qPCR. Dotted lines depict the ratios of summed qPCR abundances to total Synechococcus abundances determined by flow cytometry (qPCR sum/Syn FC).
Figure A1
Figure A1
Phylogenetic tree based on 1009 positions of the 16S rDNA gene. The trees were constructed in PAUP using the HKY + i + g model. Values at the nodes indicate the bootstrap support from 1000 trees found by neighbor joining and the HKY + i + g substitution model. The names of strains used in the four loci concatenated tree in Figure A6 are in bold. Clade designations are indicated with solid vertical lines.
Figure A2
Figure A2
Phylogenetic tree based on 322 positions of the 16S–23S rDNA ITS. The tree shown is the best scoring tree, as determined by maximum likelihood score, amongst 1000 neighbor joining trees constructed using the HKY + i + g substitution model and with randomized addition of taxa. Clade groupings shown in this neighbor joining tree are also supported by bootstrap analysis using maximum likelihood with the GTRGAMMA model in RAxML (1000 replicates) and neighbor joining and the HKY + i + g substitution model (1000 replicates). Nodes display bootstrap values (ML/NJ) where bootstrap support is >50% in at least one method. Clades were collapsed into groups represented by trapezoids. The number inside or to the right of the trapezoid indicates the number of sequences in that clade or subcluster. Clade designations are indicated with solid vertical lines, and representative strains within the clades are shown to the left of clade labels. Clade XV forms a monophyletic clade highly supported by bootstrap analysis (80/86, not shown on tree) and groups together with clade II strains. For clades for which qPCR assays were designed, numbers to the right of clade names show the number of sequences that have zero, one to two, or greater than two mismatches to both the forward and reverse qPCR primers combined (0 mismatches/1–2 mismatches/>2 mismatches).
Figure A3
Figure A3
Phylogenetic tree based on 648 nucleotide positions of the narB gene. Tree construction, bootstrap analysis, and taxa and clade labels as the same as described in Figure A1. Because of the large number of sequences, selected sequences are grouped together and represented by trapezoids. The number inside the trapezoid indicates the number of sequences in that group. Strains within those groups that have been used in the concatenated tree (Figure A6) are shown to the right of the trapezoids. The assignment of narB sequences to groups according to Paerl et al. (2011) is indicated with dashed lines. Group A, Group B, and Group G encompass multiple well-established clades as defined by phylogenies of other loci. Numbers below group names indicate the number of total mismatches that sequences within the group have to the primers and probe sets described in Paerl et al. (2011) (0 mismatches/1 or 2 total mismatches/>2 mismatches). For Group G which contains multiple clades as defined by other loci, the number of mismatches is also given for sequences belonging to clades II, III, and XV. Two primer and probe sets were designed to detect subgroups of Group D, D_C1, and D_C2 (designated with blue lines), and the number of mismatches that sequences have to their respective primer probe sets are given.
Figure A4
Figure A4
Phylogenetic tree based on 297 nucleotide positions of the ntcA gene. Tree construction, bootstrap analysis, and taxa and clade labels are the same as described in Figure A1. Clade designations are listed as described in Penno et al. (2006) except that sequences formerly classified as clade XIII cluster with clade VII strain UW92 and these sequences have been reclassified to clade VII. Clades I, III, and XII contain groups of sequences that may warrant classification into new clades because they are as divergent from other sequences in their own clade as they are to other clades. These groups of sequences are labeled with a dashed line and a “?” following the clade name assigned by Penno et al.
Figure A5
Figure A5
Phylogenetic tree based on 460 nucleotide positions of the rpoC1 gene. Tree construction, bootstrap analysis, and taxa and clade labels are the same as described in Figure A1. Prochlorococcus strain MIT 9313 was used as the outgroup.
Figure A6
Figure A6
Phylogenetic tree based on concatenation of four loci: the 16S rDNA gene, the ITS, ntcA, and rpoC1. Tree construction, bootstrap analysis, and taxa and clade labels as the same as described in Figure A1 except that bootstrap values at the nodes were obtained using three methods: (neighbor joining, HKY + i + g model, 100 replicates/neighbor joining, Jukes–Cantor model, 1000 replicates/maximum likelihood, GTRGAMMA model, 1000 replicates). Phylogeny based on 1,129 core genes from strains with sequenced genomes support the division of strains subcluster 5.1 into two groups 5.1A (blue bar) and 5.1B (solid red bar) (Dufresne et al., 2008). The four loci concatenated phylogeny in Figure A6 also supports the grouping of 5.1A strains, including clade XV. Strains in clades VII, CRD1, and XVI cluster with other 5.1B strains in clades V and VI with high bootstrap support, however it is unclear if these additional new strains without sequenced genomes form a single monophyletic cluster with all 5.1B strains (dashed red line).

References

    1. Ahlgren N. A., Rocap G. (2006). Culture isolation and culture-independent clone libraries reveal new marine Synechococcus ecotypes with distinctive light and N physiologies. Appl. Environ. Microbiol. 72, 7193–720410.1128/AEM.00358-06 - DOI - PMC - PubMed
    1. Ahlgren N. A., Rocap G., Chisholm S. W. (2006). Measurement of Prochlorococcus ecotypes using real-time polymerase chain reaction reveals different abundances of genotypes with similar light physiologies. Environ. Microbiol. 8, 441–45410.1111/j.1462-2920.2005.00910.x - DOI - PubMed
    1. Apple J., Strom S., Palenik B., Brahamsha B. (2011). Variability in protist grazing and growth on different marine Synechococcus isolates. Appl. Environ. Microbiol. 77, 3074–308410.1128/AEM.02241-10 - DOI - PMC - PubMed
    1. Bar T., Stahlberg A., Muszta A., Kubista M. (2003). Kinetic outlier detection (KOD) in real-time PCR. Nucleic Acids Res. 31, e105.10.1093/nar/gng106 - DOI - PMC - PubMed
    1. Beja O., Suzuki M. T., Koonin E. V., Aravind L., Hadd A., Nguyen L. P., Villacorta R., Amjadi M., Garrigues C., Jovanovich S. B., Feldman R. A., DeLong E. F. (2000). Construction and analysis of bacterial artificial chromosome libraries from a marine microbial assemblage. Environ. Microbiol. 2, 516–52910.1046/j.1462-2920.2000.00133.x - DOI - PubMed

LinkOut - more resources