. 2012 Jun 19:3:135.
doi: 10.3389/fpls.2012.00135. eCollection 2012.

Retrograde signaling in plants: from simple to complex scenarios

Affiliations

Retrograde signaling in plants: from simple to complex scenarios

Dario Leister. Front Plant Sci. .

Abstract

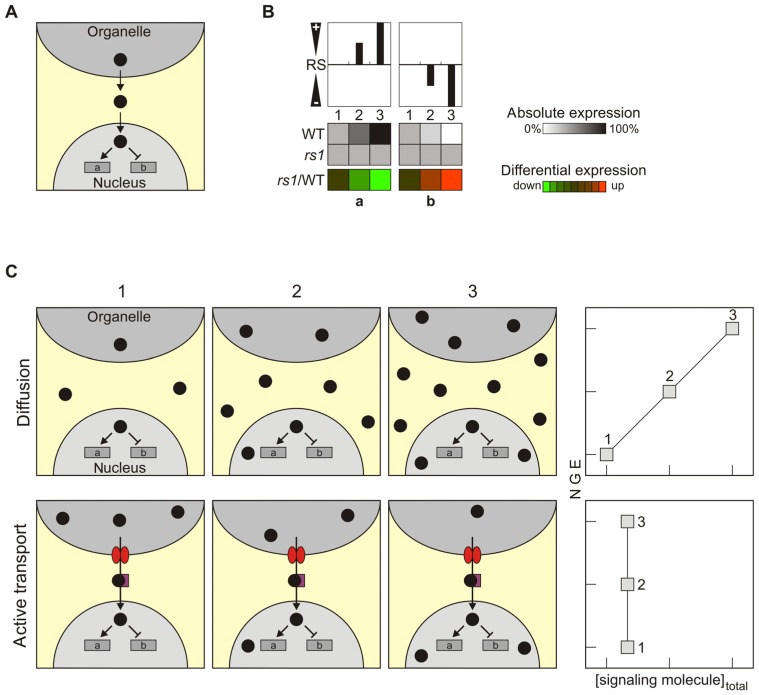
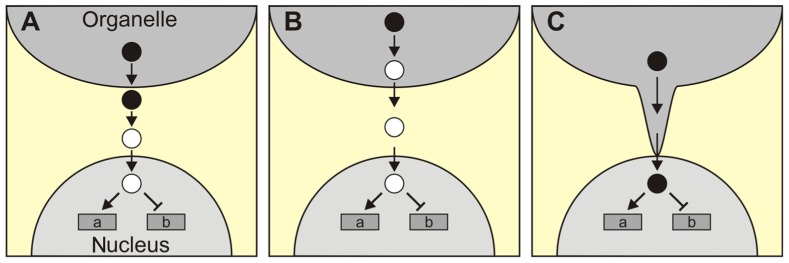
The concept of retrograde signaling posits that signals originating from chloroplasts or mitochondria modulate the expression of nuclear genes. A popular scenario assumes that signaling factors are generated in, and exported from the organelles, then traverse the cytosol, and act in the nucleus. In this scenario, which is probably over-simplistic, it is tacitly assumed that the signal is transferred by passive diffusion and consequently that changes in nuclear gene expression (NGE) directly reflect changes in the total cellular abundance of putative retrograde signaling factors. Here, this notion is critically discussed, in particular in light of an alternative scenario in which a signaling factor is actively exported from the organelle. In this scenario, NGE can be altered without altering the total concentration of the signaling molecule in the cell as a whole. Moreover, the active transport scenario would include an additional level of complexity, because the rate of the export of the signaling molecule has to be controlled by another signal, which might be considered as the real retrograde signal. Additional alternative scenarios for retrograde signaling pathways are presented, in which the signaling molecules generated in the organelle and the factors that trigger NGE are not necessarily identical. Finally, the diverse consequences of signal integration within the organelle or at the level of NGE are discussed. Overall, regulation of NGE at the nuclear level by independent retrograde signals appears to allow for more complex regulation of NGE than signal integration within the organelle.

Keywords: nuclear gene expression; plastid signaling; retrograde signaling; signal integration.


Figures

FIGURE 1
FIGURE 1
Characteristics and transport of classical retrograde signals. (A) Schematic overview of the mode of operation of the simplest scenario for retrograde signaling, the case of a classical retrograde signal. (B) Overview of how changes in the relative abundance of the retrograde signal (RS) in the nucleus might affect NGE. Relative levels of the RS increase from state 1 (0%), state 2 (50%) to state 3 (100%), resulting in either induction (gene a) or repression (gene b) of the expression of a nuclear reporter gene (indicated in grayscale). The repressive effect of the RS is symbolized in the top panel by negative values (“-”), the inducing effect by positive values (“+”). In a signaling mutant rs, no expression changes occur and therefore differential expression (rs1/WT) in terms of down-regulation (gene a) or up-regulation (gene b) is observed (shown in color scale). (C) Passive diffusion versus active transport of RS. If the signaling molecule is disseminated by diffusion (upper panels, “Diffusion”), the total concentration of the signaling molecule in all cellular components increases during the transition from state 1 to state 3, leading to changes in NGE. In this case, a linear correlation between the total concentration of the signaling molecule and NGE is expected. If the signaling molecule is actively transported into the nucleus (lower panel, “Active transport”), NGE can be altered by specifically changing the abundance of the signaling molecule in the nucleus – without altering its total concentration in the cell as a whole. In consequence, analyses of total cell extracts would fail to identify any correlation between the overall abundance of the signaling molecule and NGE. The tetrapyrrole Mg-protoporphyrin IX, for which total cellular levels fail to correlate with changes in NGE, might represent such a signal. Note that the “active transport scenario” would require regulation of the activity of the transport by another signal. In fact, in such a scenario the signal that up-regulates export might be considered as the real signal, and the transported compound as second messenger.
FIGURE 2
FIGURE 2
More complex scenarios for retrograde signaling. (A) The signaling molecule generated in and exported from the organelle (filled circles), and the signaling molecule that enters the nucleus (open circles) might not be identical. ABA, which is synthesized in the cytosol from a chloroplast precursor, is a possible example. (B) The signaling molecule generated in the organelle might not even leave the organelle. 1O2 serves here as an example, as it could, in principle, generate volatile oxidation products of carotenoids that serve as “downstream” messengers. (C) Direct delivery of the signaling molecule to the nucleus via stromules.
FIGURE 3
FIGURE 3
Signal integration. (A) Schematic overview of the integration of two retrograde signals (RS1 and RS2) in the nucleus (left panel) or in the organelle (right panel). O1 and O2 refer to signals acting within the organelle. Activating signals are indicated by arrows, repressing signals by blunt-ended lines. Left panel (two retrograde signals, integration in the nucleus): gene a′, induced by RS1 and RS2; gene b′, repressed by RS1 and induced by RS2; gene c′, induced by RS1 and repressed by RS2; gene d′, repressed by RS1 and RS2. Right panel (two organellar signals, integration in the organelle): RS induces gene a and represses gene b as in Figure 1A. (B) Signal integration at the gene level. In this model each of the two retrograde signals can accumulate to 0, 50, or 100% [depicted as black (RS1) or white (RS2) bars], analogous to the three states discussed in Figures 1B,C, resulting in nine different combinations, of which eight are shown in the top panels (the combination RS1: 0%/RS2: 0% is not shown). The effects on NGE are shown in WT and corresponding single (rs1 and rs2) and double (rs1 rs2) signaling mutants in grayscale. In color scale, effects on differential gene expression (mutant versus WT) are shown. In the left/right panel, the expected impact of additive inducing/repressing effects of the retrograde signals on genes a′ and d′ is shown. In the middle panel (b′/c′), the two retrograde signals act antagonistically and the outcome for the expression of genes b′ and c′ is very similar. (C) As in (B), the two organellar signals can act additively with the same polarity (O1:+/O2:+) or act antagonistically (O1:-/O2:+; O1:+/O2:-; upper panel). The net effect of OS1 and OS2 on RS is shown in the second uppermost panel and can either induce gene expression (the two left panels, gene a) or repress gene expression (the two right panels, gene b). The resulting effects on NGE are again shown in grayscale for absolute expression and in color scale for differential expression (mutant versus WT).

References

    1. Apel K., Hirt H. (2004). Reactive oxygen species: metabolism, oxidative stress, and signal transduction. Annu. Rev. Plant Biol. 55 373–399 - PubMed
    1. Baier M., Dietz K. J. (2005). Chloroplasts as source and target of cellular redox regulation: a discussion on chloroplast redox signals in the context of plant physiology. J. Exp. Bot. 56 1449–1462 - PubMed
    1. Beck C. F. (2005). Signaling pathways from the chloroplast to the nucleus. Planta 222 743–756 - PubMed
    1. Biehl A., Richly E., Noutsos C., Salamini F., Leister D. (2005). Analysis of 101 nuclear transcriptomes reveals 23 distinct regulons and their relationship to metabolism, chromosomal gene distribution and co-ordination of nuclear and plastid gene expression. Gene 344 33–41 - PubMed
    1. Bradbeer J. W., Atkinson Y. E., Börner T., Hagemann R. (1979). Cytoplasmic synthesis of plastid polypeptides may be controlled by plastid-synthesized RNA. Nature 279 816–817

LinkOut - more resources