. 2012;7(6):e37210.
doi: 10.1371/journal.pone.0037210. Epub 2012 Jun 19.

Metabolic disturbances associated with systemic lupus erythematosus

Affiliations

Metabolic disturbances associated with systemic lupus erythematosus

Tianfu Wu et al. PLoS One. 2012.

Abstract

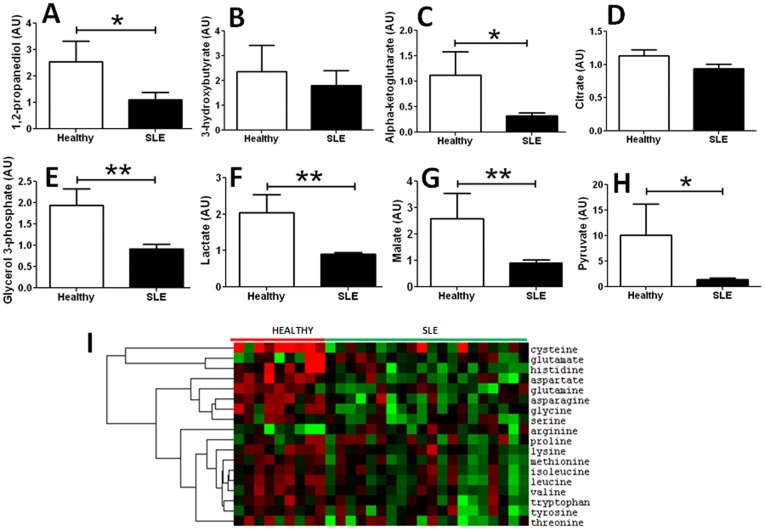
The metabolic disturbances that underlie systemic lupus erythematosus are currently unknown. A metabolomic study was executed, comparing the sera of 20 SLE patients against that of healthy controls, using LC/MS and GC/MS platforms. Validation of key differences was performed using an independent cohort of 38 SLE patients and orthogonal assays. SLE sera showed evidence of profoundly dampened glycolysis, Krebs cycle, fatty acid β oxidation and amino acid metabolism, alluding to reduced energy biogenesis from all sources. Whereas long-chain fatty acids, including the n3 and n6 essential fatty acids, were significantly reduced, medium chain fatty acids and serum free fatty acids were elevated. The SLE metabolome exhibited profound lipid peroxidation, reflective of oxidative damage. Deficiencies were noted in the cellular anti-oxidant, glutathione, and all methyl group donors, including cysteine, methionine, and choline, as well as phosphocholines. The best discriminators of SLE included elevated lipid peroxidation products, MDA, gamma-glutamyl peptides, GGT, leukotriene B4 and 5-HETE. Importantly, similar elevations were not observed in another chronic inflammatory autoimmune disease, rheumatoid arthritis. To sum, comprehensive profiling of the SLE metabolome reveals evidence of heightened oxidative stress, inflammation, reduced energy generation, altered lipid profiles and a pro-thrombotic state. Resetting the SLE metabolome, either by targeting selected molecules or by supplementing the diet with essential fatty acids, vitamins and methyl group donors offers novel opportunities for disease modulation in this disabling systemic autoimmune ailment.


Conflict of interest statement

Competing Interests: Dr. Weiel is a full time employee of Metabolon. This does not alter the authors' adherence to all the PLoS ONE policies on sharing data and materials. Other than the above, all authors have declared that no competing interests exist.

Figures

Figure 1
Figure 1. Key metabolic imbalances in SLE affecting carbohydrate, lipid or amino acid metabolism.
The sera of 20 SLE patients and 9 healthy controls were comprehensively scanned for differences in small molecules using LC/MS and GC/MS platforms, referred to as the “metabolomic scan”. Shown are the mean metabolite levels of 3 glycolytic intermediates (A–C), three Kreb’s cycle intermediates (D–F), and two products of fatty acid β-oxidation (G–H). Open bars = healthy controls; closed bars = SLE patients. (*,P<0.05; **,P<0.01; ***,P<0.001). Plotted in (I) is a heatmap of serum amino acid levels in healthy subjects (first 9 columns) versus SLE patients (rightmost 20 columns), as determined by the metabolomic scan described above. Red = elevated; green = reduced, relative to the mean levels of the metabolite within the 29 study subjects. The actual mean levels of the metabolites are listed in Supplementary Table S1.
Figure 2
Figure 2. Lipid profiles and methyl group donors in SLE.
Plotted in the heatmap in (A) are the serum levels of long chain fatty acids (FA) and medium chain FA in 9 healthy controls and 20 SLE subjects, as determined by the metabolomic scan. Presentation details are as in Fig. 1(I). In the metabolomic scan, additional differences were noted in the serum levels of 9-HODE and 13-HODE (C), methionine (F), cysteine (G), choline (H) and vitamin B6 (I); presentation details are as in Fig. 1. In (C) and (I), the SLE patients have been segregated into 2 groups - mild SLE (SLEDAI <6; N = 10) and active SLE (SLEDAI >5; N = 10). Also plotted are validation assays for serum levels of free fatty acids (FFA; B), the lipid peroxidation marker, MDA (D), glutathione (GSH; E), and vitamin B6 (J), ascertained in an independent cohort of 38 SLE patients and 14 healthy controls, using commercially available assays, independent of the original metabolomic scan. Each dot represents data from an individual subject (*,P<0.05; **,P<0.01; ***,P<0.001).
Figure 3
Figure 3. Metabolic markers that best distinguish SLE from healthy controls.
Plotted in (A) is a heatmap of a cluster of metabolites that were elevated in SLE sera; presentation details are listed in Fig. 1(I). The metabolites that were best at discriminating SLE from controls (based on the results from the original metabolomic scan of 20 SLE patients and 9 healthy controls) were identified and ordered using a Random Forest analysis algorithm (B). The markers are listed in decreasing order of disease-discriminatory potential. Also plotted are validation assays for serum levels of leukotriene B4 (C), 5-HETE (D), and serum GGT1 (E) ascertained in an independent cohort of 38 SLE patients and 14 healthy controls, using commercially available kits, independent of the original metabolomic scan (*,P<0.05; **,P<0.01; ***,P<0.001).
Figure 4
Figure 4. Sensitivity and specificity profiles of new metabolic markers in SLE.
The levels of the 4 markers indicated were tested in serum samples from RA patients (open dots; N = 20) and SLE patients (closed dots; N = 38) (A–D). Each dot represents data from a single individual. (*,P<0.05; **,P<0.01; ***,P<0.001). The dotted line represents the mean serum levels in healthy controls (N = 14). The potential of the different markers in distinguishing SLE from healthy controls (red bold line), or from RA disease controls (black dotted line) were also analyzed using ROC curves, as displayed for leukotriene B4 (E), MDA (F), GGT1 (G) and glutathione (H), based on the serum levels observed in the independent cohort of 38 SLE patients, 20 RA patients and 14 healthy controls, in the validation assays plotted in A–D. The ROC curves plot (1-Specificity) % on the x-axis versus the Sensitivity (%) on the Y-axis, for each marker. AUC = Area under ROC curve.
Figure 5
Figure 5. An overview of the metabolic imbalances in SLE.
The most significant metabolic alterations in SLE have been organized into different biochemical pathways, including glycolysis (A), Krebs cycle (B), fatty acid oxidation (C), amino acid pools (D), lipid biosynthesis (E), essential FA (F), eicosanoid biosynthesis (G) and methyl group interchange pathways (H) leading to glutathione generation (I). Metabolites that were elevated in SLE are in red font, while reduced metabolites are in green font. Mitochondrial events are blue-boxed, while events that take place in the endoplasmic reticulum are yellow-boxed. Salient metabolic consequences that can potentially contribute to the manifestations of SLE are highlighted in pink.

References

    1. Fernandez D, Perl A. Metabolic control of T cell activation and death in SLE. Autoimmun Rev. 2009;8:184–189. - PMC - PubMed
    1. Deckelbaum RJ. n-6 and n-3 Fatty acids and atherosclerosis: ratios or amounts? Arterioscler Thromb Vasc Biol. 2010;30:2325–2326. - PubMed
    1. Wan JB, Huang LL, Rong R, Tan R, Wang J, et al. Endogenously decreasing tissue n-6/n-3 fatty acid ratio reduces atherosclerotic lesions in apolipoprotein E-deficient mice by inhibiting systemic and vascular inflammation. Arterioscler Thromb Vasc Biol. 2010;30:2487–2494. - PubMed
    1. Nuttall SL, Heaton S, Piper MK, Martin U, Gordon C. Cardiovascular risk in systemic lupus erythematosus–evidence of increased oxidative stress and dyslipidaemia. Rheumatology (Oxford) 2003;42:758–762. - PubMed
    1. Boffa JJ, Rougier JP, Noel N, Ronco P. [High cardiovascular complications in systemic lupus erythematosus: physiopathology and risk management]. Nephrol Ther. 2009;5:595–602. - PubMed

Publication types