. 2012;7(6):e38941.
doi: 10.1371/journal.pone.0038941. Epub 2012 Jun 12.

Mouse SPNS2 functions as a sphingosine-1-phosphate transporter in vascular endothelial cells

Affiliations

Mouse SPNS2 functions as a sphingosine-1-phosphate transporter in vascular endothelial cells

Yu Hisano et al. PLoS One. 2012.

Abstract

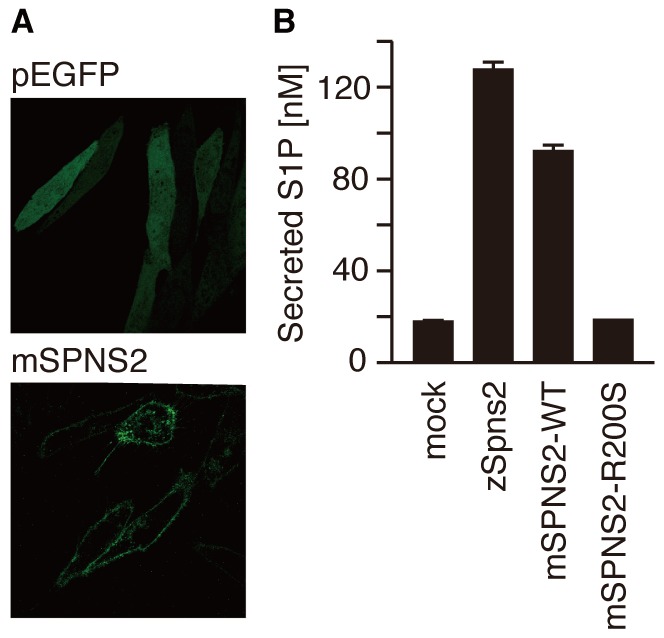
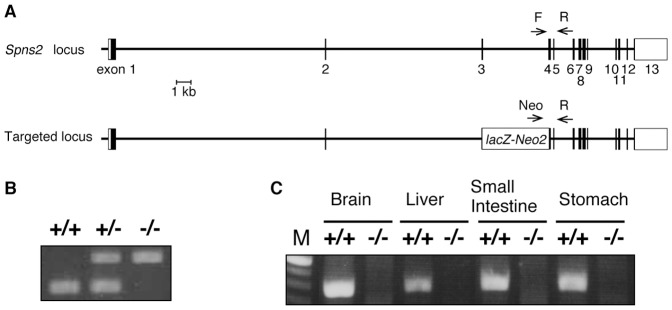
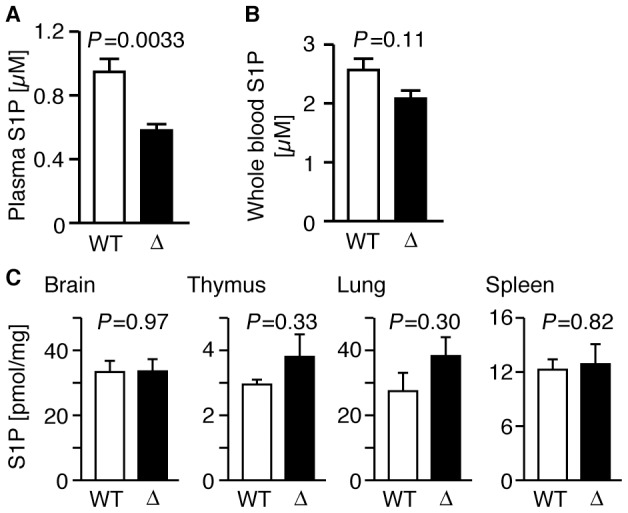
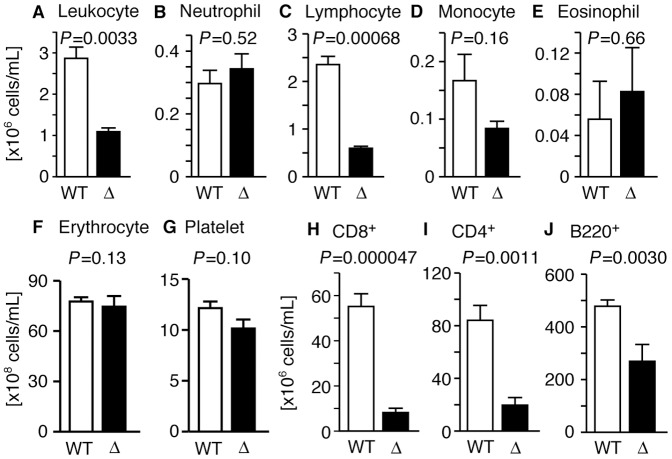
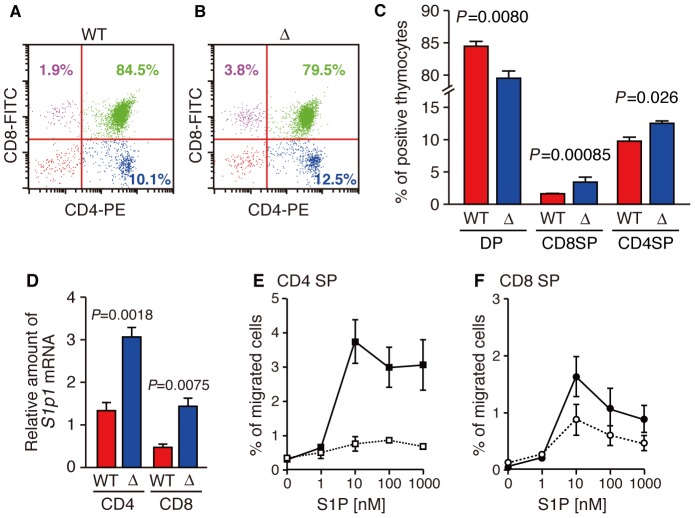
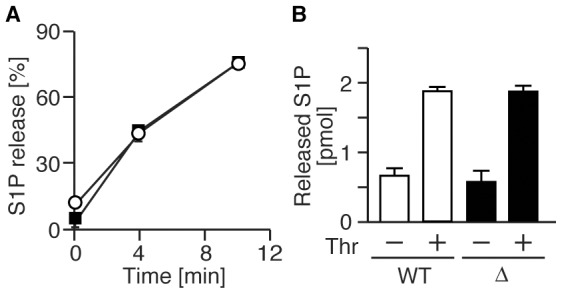
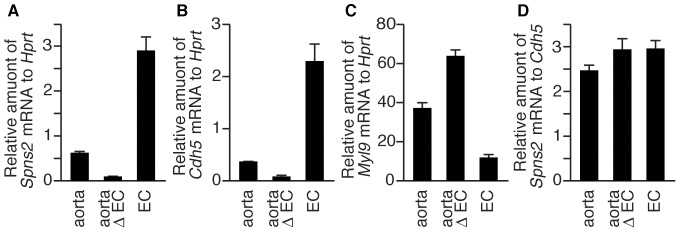
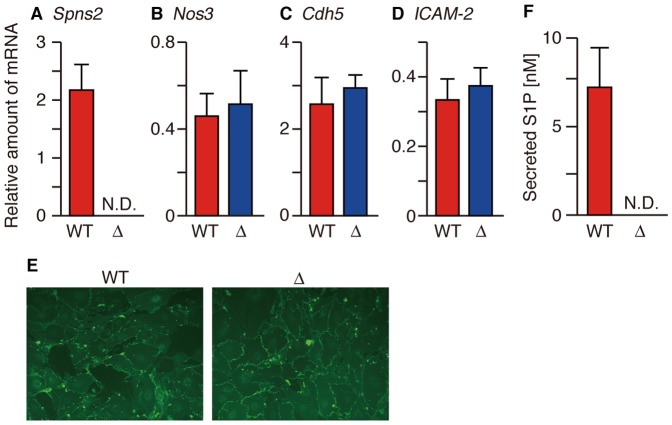
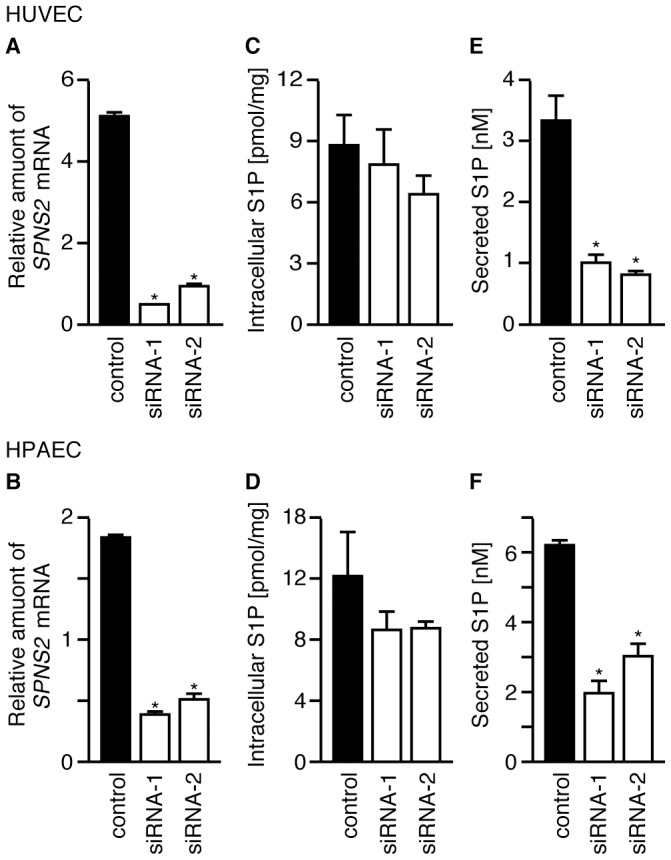
Sphingosine-1-phosphate (S1P), a sphingolipid metabolite that is produced inside the cells, regulates a variety of physiological and pathological responses via S1P receptors (S1P1-5). Signal transduction between cells consists of three steps; the synthesis of signaling molecules, their export to the extracellular space and their recognition by receptors. An S1P concentration gradient is essential for the migration of various cell types that express S1P receptors, such as lymphocytes, pre-osteoclasts, cancer cells and endothelial cells. To maintain this concentration gradient, plasma S1P concentration must be at a higher level. However, little is known about the molecular mechanism by which S1P is supplied to extracellular environments such as blood plasma. Here, we show that SPNS2 functions as an S1P transporter in vascular endothelial cells but not in erythrocytes and platelets. Moreover, the plasma S1P concentration of SPNS2-deficient mice was reduced to approximately 60% of wild-type, and SPNS2-deficient mice were lymphopenic. Our results demonstrate that SPNS2 is the first physiological S1P transporter in mammals and is a key determinant of lymphocyte egress from the thymus.


Conflict of interest statement

Competing Interests: The authors have declared that no competing interests exist.

Figures

Figure 1
Figure 1. Mouse SPNS2 exports S1P from the cells.
(A) Cellular localization of mouse SPNS2. CHO-SPHK1 cells expressing EGFP or mSPNS2-EGFP were observed by confocal fluorescence microscopy (LSM5 Pascal, Carl Zeiss). (B) The endogenous S1P released from CHO-SPHK1 cells expressing EGFP, mSPNS2-EGFP or mSPNS2-R200S-EGFP was separated and quantitated with C17-S1P (internal standard) by HPLC. The release of endogenous S1P was observed in mSPNS2-EGFP-transfected cells but not in EGFP-expressing or mSPNS2 (R200S)-EGFP-expressing cells. The graph shows the average values from three experiments, with error bars representing the standard error.
Figure 2
Figure 2. SPNS2-deficient mice.
(A) Targeting scheme to generate the Spns2 genomic deletion allele. The exons of the putative coding and noncoding regions are shown as black and white boxes, respectively. The LacZ-neor cassette in the deleted allele is indicated with a white rectangle. The primers used for genotyping are indicated by arrows. (B) Deletion of mouse Spns2 from the genome was confirmed with PCR using genomic DNA isolated from Spns2 +/+, Spns2 +/− and Spns2 −/− mouse tails. (C) Knock-out of mouse Spns2 was confirmed by conventional RT-PCR using mRNA isolated from Spns2 +/+ or Spns2−/− mouse tissues.
Figure 3
Figure 3. Plasma S1P concentration is decreased in SPNS2-deficient mice.
(A) Concentration of plasma S1P in wild-type (WT, n = 14) and SPNS2-deficient mice (Δ, n = 9). The P-value from comparisons between WT and Δ samples is indicated. (B) Concentration of whole blood S1P in wild-type (WT, n = 7) and SPNS2-deficient mice (Δ, n = 5). (C) S1P contents of mouse tissues. S1P contents of brain, thymus, lung and spleen from wild-type (WT, n = 3) or SPNS2-deficient (Δ, n = 3) mice were measured by HPLC. C17-S1P was used as the internal standard. Graphs show the average values from multiple experiments, with error bars representing the standard error. The P-values of comparisons between WT and Δ samples is indicated.
Figure 4
Figure 4. SPNS2 is required for normal lymphocyte egress.
(A–G) Blood from wild-type (WT, n = 3) and SPNS2-deficient mice (Δ, n = 3) was collected, and leukocytes, leukocyte subpopulations, erythrocytes and platelets were counted using flow cytometry. Bar graphs show the average values from three experiments. (H–J) Flow cytometric analysis of blood from wild-type (WT, red, n = 13) and SPNS2-deficient (Δ, blue, n = 7) mice. CD8 (H), CD4 (I) and B220 (J) were used to detect each cell type. Graphs show the average values from multiple experiments, with error bars representing the standard error. The P-value of comparisons between WT and Δ samples is indicated.
Figure 5
Figure 5. Thymocytes of SPNS2-deficient mice can mature and migrate toward S1P.
(A and B) Expression profiles for CD4 and CD8. Thymus-derived CD4+ and CD8+ cells from wild-type (A, WT, n = 5) and SPNS2-deficient (B, Δ, n = 7) mice were analyzed by flow cytometry. Each plot is representative of multiple experiments. Numbers show the percent of total lymphocytes, identified by their size. (C) The percentage corresponding to CD4+ CD8+ (DP), CD4 CD8+ (CD8SP) or CD4+ CD8 (CD4SP) populations. (D) Quantitative analysis of S1p1 mRNA in mature thymocytes. CD4 or CD8 single positive cells were purified from the thymus of wild-type (WT, n = 3) or SPNS2-deficient (Δ, n = 5) mice with MACS. The amount of S1p1 mRNA is normalized to that of Hprt. The primers and probes used for PCR are indicated in Table S2. The P-values from comparisons between WT and Δ samples are indicated. (E, F) Chemotaxis assays of mature thymocytes of wild-type (WT, n = 10) or SPNS2-deficient (Δ, n = 5) mice. The percentage of input cells of the CD62Lhi and CD4 (E) or CD8 (F) single positive phenotype that migrated toward S1P is shown. open square, wild-type CD4 single positive; closed square, SPNS2-deficient CD4 single positive; open circle, wild-type CD8 single positive; closed circle, SPNS2-deficient CD8 single positive. The graphs show the average values from multiple experiments, with error bars representing the standard error.
Figure 6
Figure 6. SPNS2 does not function in erythrocytes and platelets.
(A) Time-dependent S1P release from erythrocytes. Erythrocytes from wild-type (closed squares, n = 3) and SPNS2-deficient mice (open circles, n = 4) were incubated with [3H]sphingosine at 37 °C, and [3H]S1P exported into the medium was measured at the indicated times. S1P release is shown as a percentage: (amount of supernatant)/(total amount). (B) Thrombin induced S1P release from platelets. Platelets from wild-type (WT, n = 4) and SPNS2-deficient mice (Δ, n = 4) were incubated in the presence or absence of thrombin, and S1P released into the medium was measured by UPLC-MS/MS. The graphs show the average values from multiple experiments, with error bars representing the standard error.
Figure 7
Figure 7. Tissue distribution of Spns2 mRNAs.
Quantitative real-time PCR was performed with first strand cDNA synthesized from mRNAs of various mouse tissues. The amount of Spns2 mRNA in each tissue is shown relative to that of Hprt. The primers and probes used for PCR are given in Table S2. The graph shows the average values from four experiments, with error bars representing the standard error.
Figure 8
Figure 8. Immunohistochemical analysis of thymus.
(A–C), aorta (D) and cava (E) sections from SPNS2-heterozygous mice, stained with X-gal (blue) and immunostained with CD31 antibody (brown). a, aorta; b, blood vessel; c, cava, bar, 50 µm.
Figure 9
Figure 9. Spns2 mRNA is expressed in aortic ECs.
Quantitative real-time PCR was performed with first strand cDNA synthesized from mRNAs of the aorta. The relative amounts of Spns2 (A and D), Cdh5 (B) and Myl9 (C) mRNA were measured using total RNA prepared from mouse whole aorta (aorta), aorta where ECs were removed by the collagenase-treatment (aorta Δ EC) or ECs which were recovered from that aorta (EC). Cdh5 and Myl9 were used as ECs and smooth muscle cell marker genes, respectively. The primers and probes used for PCR are indicated in Table S2. The graph shows the average values from four experiments, with error bars representing the standard error.
Figure 10
Figure 10. SPNS2 is an S1P transporter of vascular EC.
(A–D) The relative amount of the indicated mRNAs in MAECs isolated from wild-type (WT) and SPNS2-deficient mice (Δ). The amount of each mRNA was normalized to that of Hprt. (E) CD31 expression by MAECs was detected by immunostaining with CD31 antibody. (F) The amount of endogenous S1P released from MAECs. The cells were incubated with 1% BSA for 4 hr at 37 °C, and the released S1P was measured by UPLC-MS/MS. The graphs show the average values from three experiments, with error bars representing the standard error. N.D., not detected.
Figure 11
Figure 11. SPNS2 releases S1P from human vascular ECs.
HUVECs and HPAECs were treated with two siRNAs targeting SPNS2 mRNA or with a negative control siRNA. (A and B) Relative amount of SPNS2 mRNA in cells treated with siRNA. Total RNA was isolated, and SPNS2 and GAPDH mRNA levels were determined by quantitative real-time PCR. The amount of SPNS2 mRNA is normalized to GAPDH mRNA. (C and D) Intracellular S1P. (E and F) The cells were incubated with 1% BSA for 4 hr at 37 °C, and the released S1P was measured by UPLC-MS/MS. The cells were collected, and the intracellular S1P content was measured by HPLC. C17-S1P was used as the internal standard. The graphs show the average values from three (C and E) or four (A, B, D and F) experiments, with error bars representing the standard error. *P<0.005 compared to ‘control’.

References

    1. Rosen H, Gonzalez-Cabrera PJ, Sanna MG, Brown S. Sphingosine 1-phosphate receptor signaling. Annual Review of Biochemistry. 2009;78:743–768. - PubMed
    1. Hla T, Brinkmann V. Sphingosine 1-phosphate (S1P): Physiology and the effects of S1P receptor modulation. Neurology. 2011;76:S3–S8. - PubMed
    1. Schwab SR, Cyster JG. Finding a way out: lymphocyte egress from lymphoid organs. Nature Immunology. 2007;8:1295–1301. - PubMed
    1. Spiegel S, Milstien S. The outs and the ins of sphingosine-1-phosphate in immunity. Nat Rev Immunol. 2011;11:403–415. - PMC - PubMed
    1. Ishii M, Egen JG, Klauschen F, Meier-Schellersheim M, Saeki Y, et al. Sphingosine-1-phosphate mobilizes osteoclast precursors and regulates bone homeostasis. Nature. 2009;458:524–528. - PMC - PubMed

Publication types

MeSH terms