. 2012;7(6):e39113.
doi: 10.1371/journal.pone.0039113. Epub 2012 Jun 19.

Inhibition of apoptosis blocks human motor neuron cell death in a stem cell model of spinal muscular atrophy

Affiliations

Inhibition of apoptosis blocks human motor neuron cell death in a stem cell model of spinal muscular atrophy

Dhruv Sareen et al. PLoS One. 2012.

Abstract

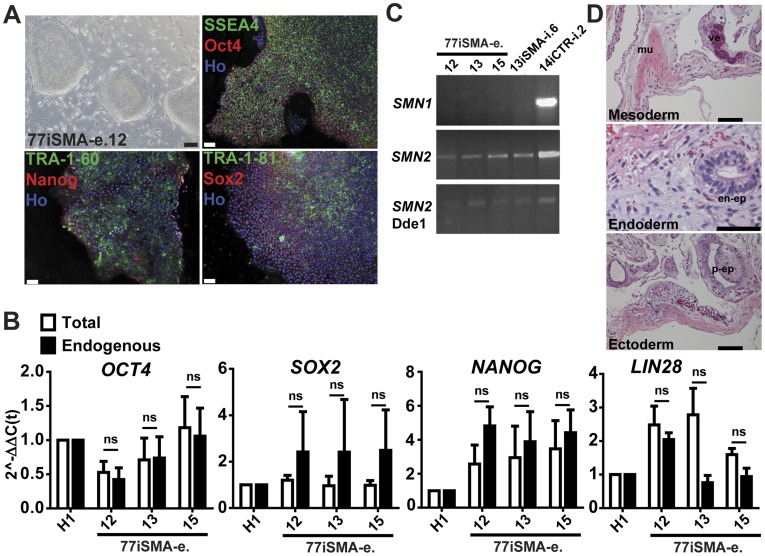
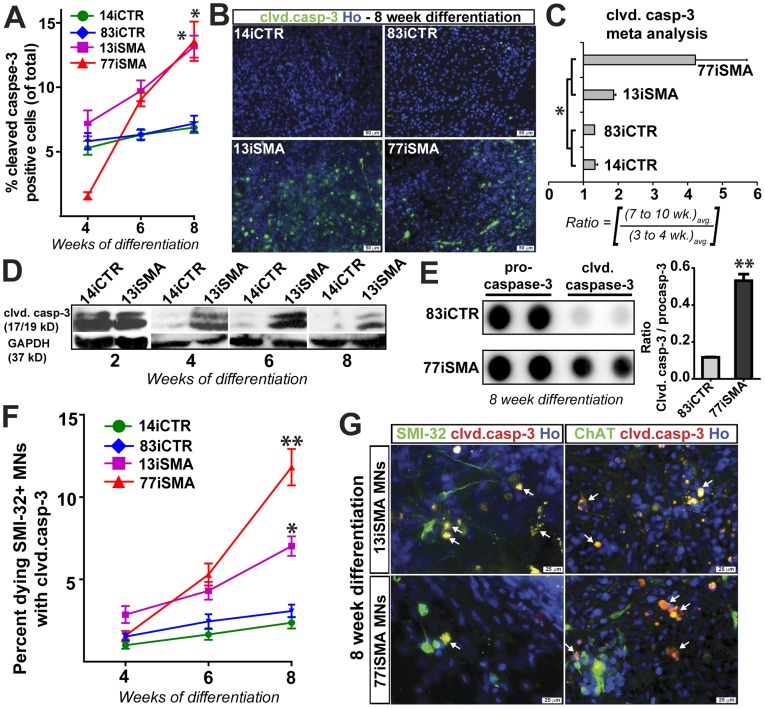
Spinal muscular atrophy (SMA) is a genetic disorder caused by a deletion of the survival motor neuron 1 gene leading to motor neuron loss, muscle atrophy, paralysis, and death. We show here that induced pluripotent stem cell (iPSC) lines generated from two Type I SMA subjects-one produced with lentiviral constructs and the second using a virus-free plasmid-based approach-recapitulate the disease phenotype and generate significantly fewer motor neurons at later developmental time periods in culture compared to two separate control subject iPSC lines. During motor neuron development, both SMA lines showed an increase in Fas ligand-mediated apoptosis and increased caspase-8 and-3 activation. Importantly, this could be mitigated by addition of either a Fas blocking antibody or a caspase-3 inhibitor. Together, these data further validate this human stem cell model of SMA, suggesting that specific inhibitors of apoptotic pathways may be beneficial for patients.


Conflict of interest statement

Competing Interests: The authors have declared that no competing interests exist.

Figures

Figure 1
Figure 1. Generation and characterization of a new SMA-iPSC line.
(A) Bright field images of the 77iSMA-e.12 SMA line showing typical pluripotent stem cell colony morphology, made by a combination of episomal vectors. Immunostaining shows expression of embryonic stem cell surface antigen SSEA4, Tra-1-60, Tra-1-81, and nuclear Oct4. (B) Quantitative RT–PCR analyses of OCT4, SOX2, NANOG, cMYC, KLF4, LIN28 expression in seven clones of 77iSMA iPSCs relative to H1 hESCs. “Endogenous” indicates that primers were included in the 3′ untranslated region (UTR) measure expression of the endogenous gene only, whereas “total” indicates that primers in coding regions measure expression of both the endogenous gene and the transgene if present. Gene expression differences were not significant (ns) by one-way ANOVA and data are represented as mean ± SD. (C) 77iSMA and 13iSMA iPSCs show the expected lack of SMN1 expression and maintenance of SMN2 expression. (D) Hematoxylin and eosin (HE) histology from teratoma tissue in nude mice kidney capsule grown for 6 weeks, showing striated muscle (mu) and a vessel (ve) of mesodermal origin, endodermal-epithelia (en-ep) of intestinal character, and ectodermal epithelia of peridermal (p-ep) character. Scale bars: 100 µm.
Figure 2
Figure 2. Motor neuron (MN) differentiation from iPSCs.
(A) Schematic representation of MN differentiation from iPSCs out to 10 weeks. (B, C and D) Differentiated human iPSCs are capable of developing into both (B) early, (C) intermediate, and (D) mature MN markers indicative of lineage restriction. (D) Detection of SMN protein in the nuclei (gems) and cytoplasm of choline acetyltransferase (ChAT) positive MNs derived from control iPSCs (83iCTR). Representative images for MN differentiation depicted here are from healthy control subject iPSCs (14iCTR or 83 iCTR). Scale bars: 50 µm.
Figure 3
Figure 3. SMA MN cultures display a degenerative phenotype.
(A) At 10 weeks of differentiation, both SMA patient-iPSC lines show a significant reduction of SMI-32+ MNs compared to both control iPSC lines. However, the Tuj1+ (βIII-tubulin) neuronal population is unaffected. These data are represented as mean ± SEM and are quantified in (B and C); the graphs are represented as percent positive TuJ1 or SMI-32 cells of the total Hoechst positive population. There was no significant difference in Tuj1 positive neuron numbers observed between the control and SMA cells at 3, 7 and 10 weeks of MN patterning. (C) There is a reduction of total cell body area and total number of processes in the SMA cell lines at late stages of differentiation compared to control iPSCs. (D) Meta-analysis of SMI-32 and TuJ1 counts confirms a significant reduction in SMI-32+ MNs in SMA cells. (C and D) Data are represented according to the longitudinal differentiation equation (Materials and Methods) as mean ± SEM, n = 4 independent experiments. Scale bars  = 50 µm. * p<0.05, ** p<0.01.
Figure 4
Figure 4. Detection of apoptosis in SMA MN cultures.
(A and B) Both SMA-iPSC MN cultures showed an increase in cleaved caspase-3 staining over time compared to control iPSC MN cultures. Representative images are shown in B. (C) Meta-analysis confirms the increase in caspase-3 activation in SMA-iPSC MN cultures. Data are represented according to the longitudinal differentiation equation (Materials and Methods) as mean ± SEM, * p<0.05, n = 4 independent experiments. (D and E) Western blot analysis of cell lysates from SMA-iPSC MN cultures shows significant and sustained activation of caspase-3 compared to control iPSCs. (F and G) There were significantly more cleaved caspase-3/SMI-32 (F) and cleaved caspase-3/ChAT (G) double positive cells in both SMA-iPSC lines compared to control iPSC lines over time. Data in (F) are represented as mean ± SEM. White arrows indicate doubled labeled SMI-32 MNs also positive for cleaved caspase-3 and the 13iSMA and 77iSMA cultures Scale bars: 50 µm (B) and 25 µm (G).
Figure 5
Figure 5. Activation of caspase-8 in SMA MN cultures.
(A) Western blot analysis of MN patterned SMA-iPSCs cell lysates at 8 weeks show reduced SMN and MN markers Islet-1 and HB9, but increased activation of caspase-8 compared to control iPSCs. There was no difference in expression levels of Bax, Bcl-2, and AIF. GAPDH was used as a loading control. (B) Immunocytochemistry detected an increase in cleaved caspase-8 in 13iSMA MN cultures. White arrows indicate doubled labeled HB9 positive MNs that are also positive for cleaved caspase-8. (C) An increase in caspase-8 activation in 13iSMA MNs was confirmed with the Caspase Glo-8 assay, measuring caspase-8 activity by release of luminescence upon activation of caspase-8 and a cleavage of a target peptide. Data are represented as mean ± SEM, n = 3 experiments.
Figure 6
Figure 6. Fas ligand over-expression in SMA MN cultures.
(A and B) Expression of total membrane-bound Fas ligand was increased in 13iSMA cells after 6 week differentiation seen by (A) immunocytochemistry and (B) Western blot analysis. Data shown here are representative of n = 3 independent experiments.
Figure 7
Figure 7. Rescuing motor neuron loss in SMA cell lines.
(A) Treatment with Fas neutralizing antibody (FasNT Ab) significantly protected 77iSMA and 13iSMA SMI-32+ motor neurons at 8 weeks relative to 4 weeks. Data are expressed according to the longitudinal differentiation equation (Materials and Methods) as mean ± SEM, * p<0.05, n = 2 independent experiments. (B) Treatment of 13iSMA MN cultures with the specific caspase-3 inhibitor Z-DVED-FMK significantly protected SMI-32+ MNs at 8 weeks of differentiation, * p<0.05, n = 2 independent experiments.

Similar articles

Cited by

References

    1. Lefebvre S, Burlet P, Liu Q, Bertrandy S, Clermont O, et al. Correlation between severity and SMN protein level in spinal muscular atrophy. Nat Genet. 1997;16:265–269. - PubMed
    1. Burghes AH, Ingraham SE, Kote-Jarai Z, Rosenfeld S, Herta N, et al. Linkage mapping of the spinal muscular atrophy gene. Hum Genet. 1994;93:305–312. - PubMed
    1. Lefebvre S, Burglen L, Frezal J, Munnich A, Melki J. The role of the SMN gene in proximal spinal muscular atrophy. Hum Mol Genet. 1998;7:1531–1536. - PubMed
    1. Jablonka S, Rossoll W, Schrank B, Sendtner M. The role of SMN in spinal muscular atrophy. J Neurol. 2000;247:I37–I42. - PubMed
    1. Gabanella F, Butchbach ME, Saieva L, Carissimi C, Burghes AH, et al. Ribonucleoprotein assembly defects correlate with spinal muscular atrophy severity and preferentially affect a subset of spliceosomal snRNPs. PLoS One. 2007;2:e921. - PMC - PubMed

Publication types

MeSH terms