. 2012;7(6):e39328.
doi: 10.1371/journal.pone.0039328. Epub 2012 Jun 18.

Genotype-specific differences between mouse CNS stem cell lines expressing frontotemporal dementia mutant or wild type human tau

Affiliations

Genotype-specific differences between mouse CNS stem cell lines expressing frontotemporal dementia mutant or wild type human tau

Miranda E Orr et al. PLoS One. 2012.

Abstract

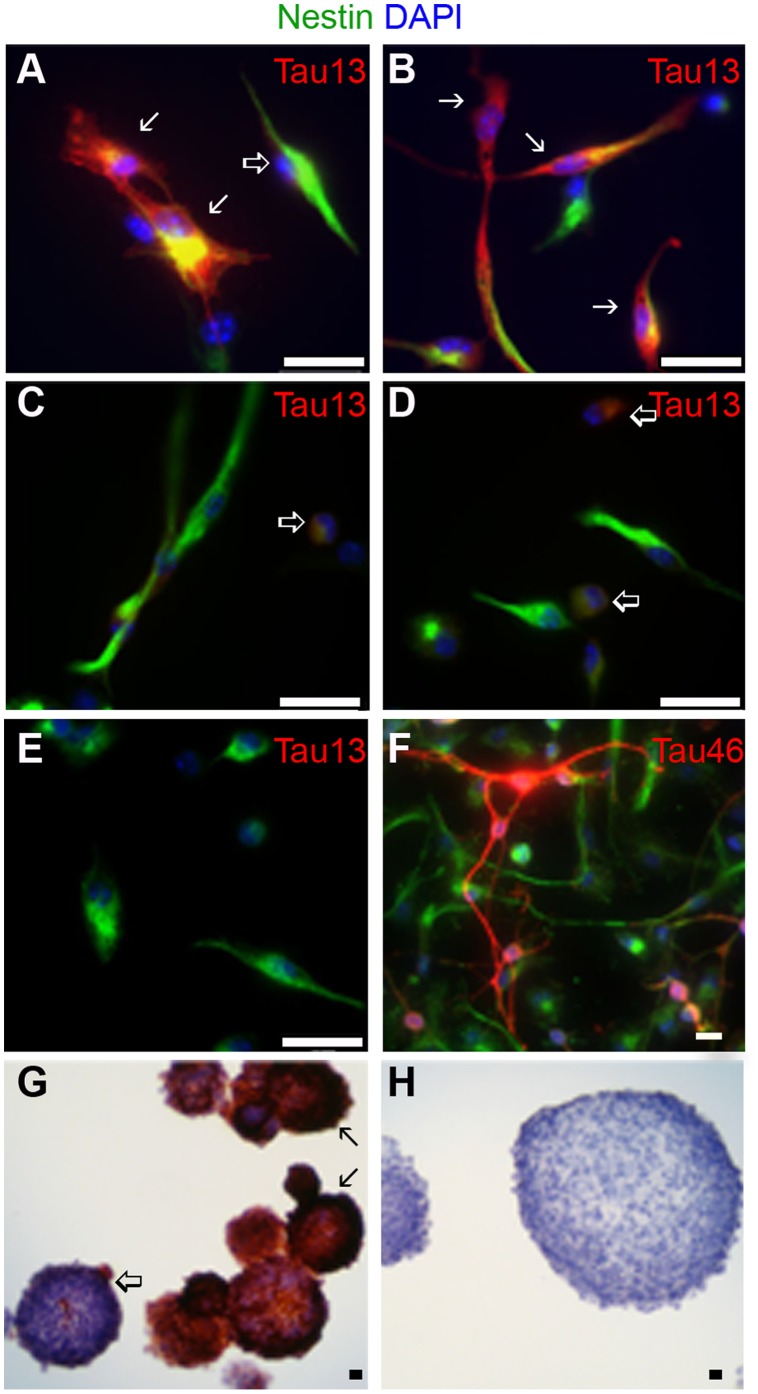
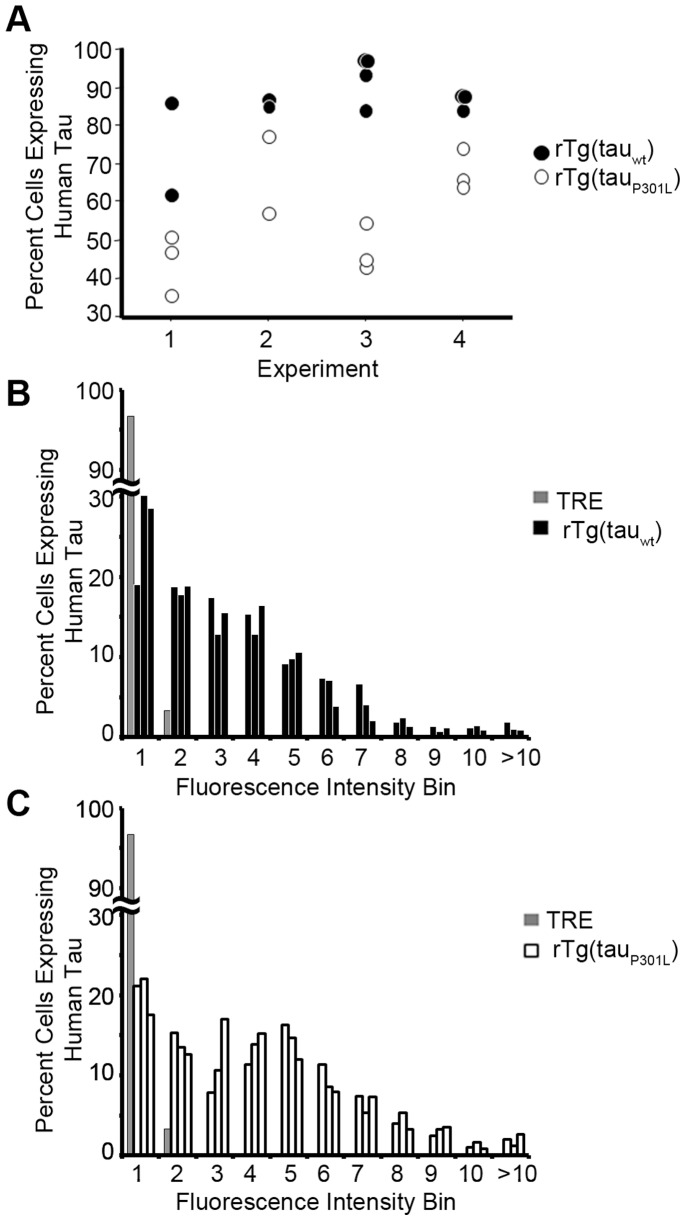
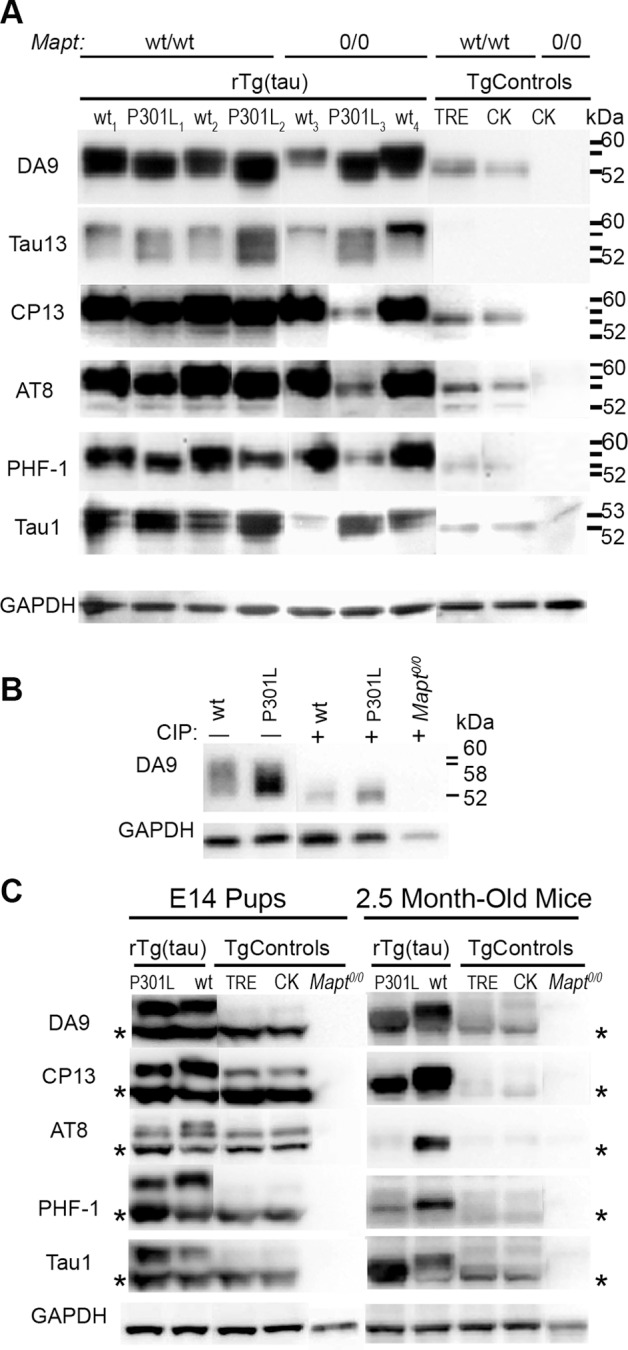
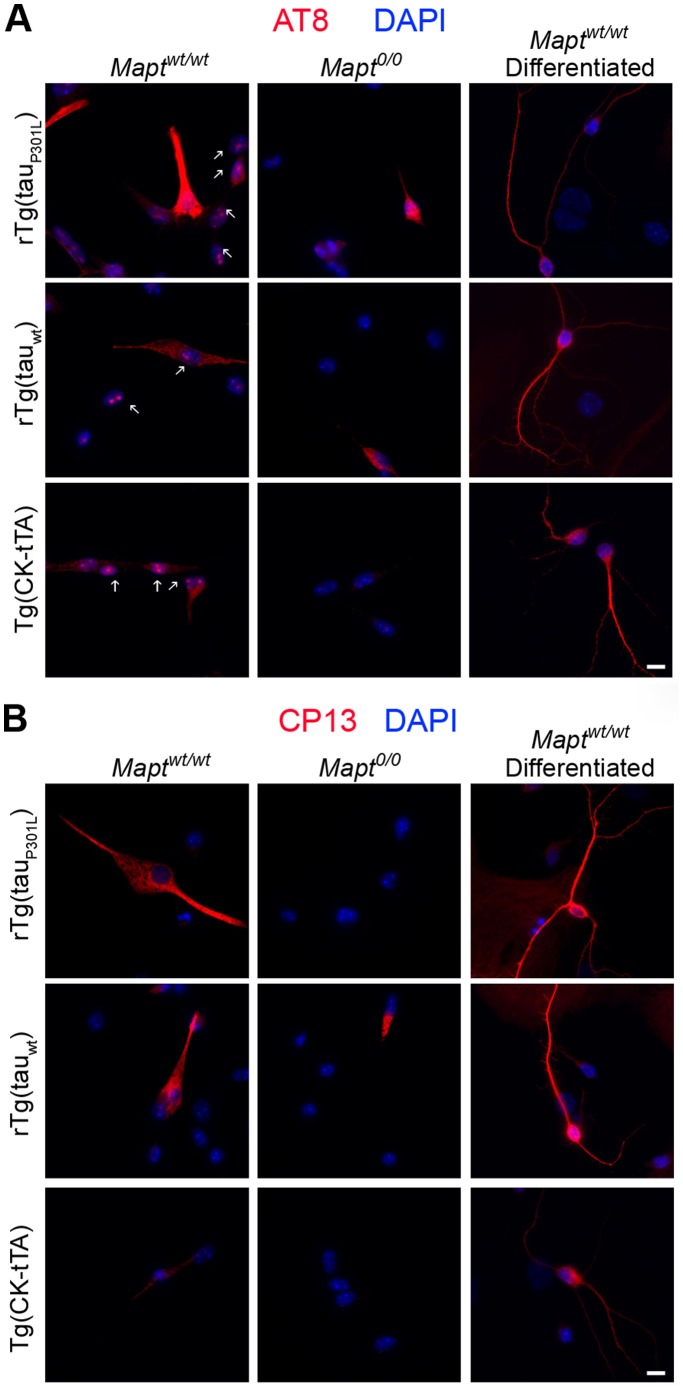
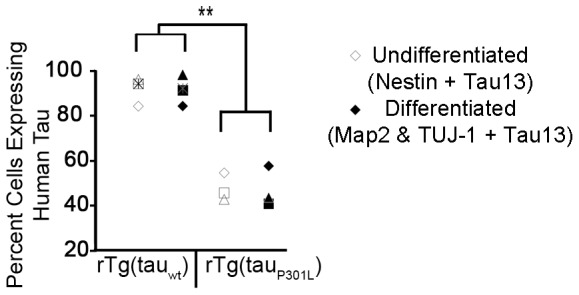
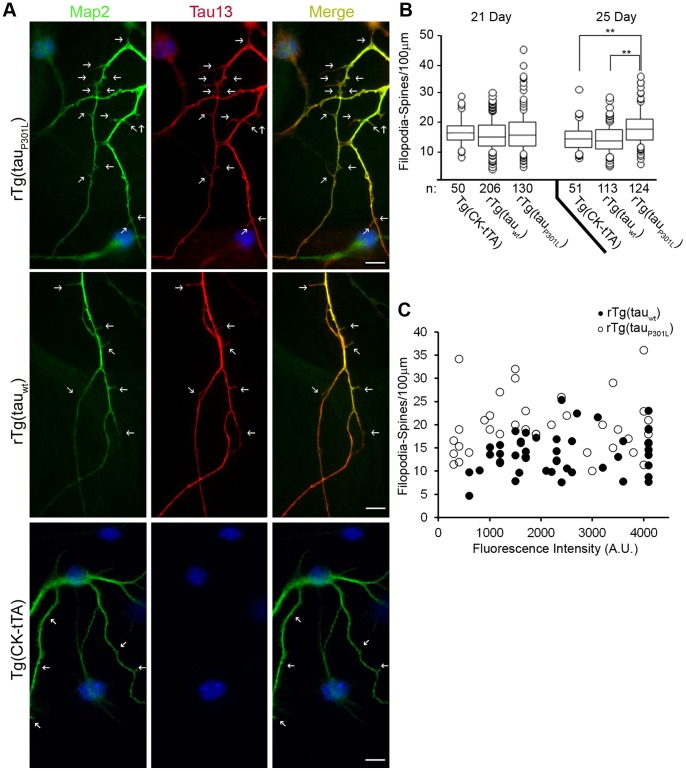
Stem cell (SC) lines that capture the genetics of disease susceptibility provide new research tools. To assess the utility of mouse central nervous system (CNS) SC-containing neurosphere cultures for studying heritable neurodegenerative disease, we compared neurosphere cultures from transgenic mice that express human tau with the P301L familial frontotemporal dementia (FTD) mutation, rTg(tau(P301L))4510, with those expressing comparable levels of wild type human tau, rTg(tau(wt))21221. rTg(tau(P301L))4510 mice express the human tau(P301L) variant in their forebrains and display cellular, histological, biochemical and behavioral abnormalities similar to those in human FTD, including age-dependent differences in tau phosphorylation that distinguish them from rTg(tau(wt))21221 mice. We compared FTD-hallmark tau phosphorylation in neurospheres from rTg(tau(P301L))4510 mice and from rTg(tau(wt))21221 mice. The tau genotype-specific phosphorylation patterns in neurospheres mimicked those seen in mice, validating use of neurosphere cultures as models for studying tau phosphorylation. Genotype-specific tau phosphorylation was observed in 35 independent cell lines from individual fetuses; tau in rTg(tau(P301L))4510 cultures was hypophosphorylated in comparison with rTg(tau(wt))21221 as was seen in young adult mice. In addition, there were fewer human tau-expressing cells in rTg(tau(P301L))4510 than in rTg(tau(wt))21221 cultures. Following differentiation, neuronal filopodia-spine density was slightly greater in rTg(tau(P301L))4510 than rTg(tau(wt))21221 and control cultures. Together with the recapitulation of genotype-specific phosphorylation patterns, the observation that neurosphere lines maintained their cell line-specific-differences and retained SC characteristics over several passages supports the utility of SC cultures as surrogates for analysis of cellular disease mechanisms.


Conflict of interest statement

Competing Interests: The authors have declared that no competing interests exist.

Figures

Figure 1
Figure 1. rTg(tauwt) and rTg(tauP301L) fetuses and neurospheres expressed transgene encoded human tau.
(A–C) Brains were taken from Tg(CK-tTA) × TRE-tau pups at E12 (A) E13 (B) and E14 (C) for WB analysis with the human specific anti-tau antibody, Tau13. We saw immunoreactivity only in brain homogenates from pups that genotyped positive for both transgenes. None of the samples from pups with either the transactivator or responder transgene alone or with neither transgene were immunoreactive with Tau13. (D–G) Neurosphere cultures generated from E14 Tg(CK-tTA) × Tg(tau) mouse litters grew as non-adherent neurospheres and expressed human tau. (D) Representative phase contrast image of neurospheres in culture. (E–G) Fixed and cryosectioned neurospheres analyzed by fluorescence microscopy demonstrated that nearly all cells in Tg(CK-tTA) (E), rTg(tauP301L) (F), and rTg(tauwt) (G) expressed the CNS-SC protein, nestin (green). rTg(tauP301L) (F) and rTg(tauwt) (G) neurospheres contained cells that were strongly immunoreactive with Tau13 (red); control Tg(CK-tTA) (E) neurospheres did not. DAPI nuclear stain is blue in E–G. (H) Western blot analysis from two independent rTg(tauwt) neurosphere cell lines (cultures 1 and 2) and two independent rTg(tauP301L) neurosphere cell lines (cultures 3 and 4) showed comparable levels of human tau between genotypes. Tau13 immunoreactivity was normalized to GAPDH. The normalized values indicated that human tau levels were comparable between genotypes. Lysates from cultures 1 and 2 were probed together on one blot, and lysates from cultures 3 and 4 were probed together on another. Control samples expressing only endogenous mouse tau (Mapt+/+), or neither mouse nor human tau (Mapt0/0) were included on each membrane; only one set is shown here for the sake of simplicity.
Figure 2
Figure 2. Single-cell staining revealed protein expression heterogeneity in transgene expressing cells.
Nestin staining is shown in green (A through F), Tau13 (A through E) or Tau46 (F) in red, and DAPI in blue (A through F). A proportion of cells from rTg(tauwt) (21–30%) (A) and rTg(tauP301L) (38–44%) (B) cultures displayed strong immunoreactivity with Tau13 (solid arrow), while others had weak immunoreactivity with Tau13 (open arrow). Cultures containing responder transgene alone, TRE-tauwt (C) and TRE-tauP301L (D), did not contain any cells with strong Tau13 immunoreactivity, but they did contain some cells with weak immunoreactivity (open arrows) indicative of leaky transgene expression. (E) Cultures containing only the transactivator transgene, Tg(CK-tTA), did not express human tau but were immunoreactive with Tau46 (F), an anti-tau antibody that reacts with both mouse and human tau. Nearly all cells of all genotypes were immunoreactive with the anti-nestin antibody (green). Scale bar  = 25 µm. (G) Immunohistochemistry of cryosectioned neurospheres probed with Tau13 revealed that some neurospheres from rTg cultures, rTg(tauP301L) shown here, contained a large proportion of transgene expressing cells (closed arrow), other neurospheres from the same culture contained very few transgene expressing cells (open arrow). (H) Control Tg(CK-tTA) neurospheres were not immunoreactive with Tau13.
Figure 3
Figure 3. rTg(tauwt) neurospheres contain more human tau expressing cells than rTg(tauP301L) neurospheres.
Undifferentiated single cells (shown in Figure 2) stained with DAPI and nestin were counted and the proportion co-expressing Tau13 was determined. (A) Consistently the proportion of cells co-expressing Tau13 was significantly higher in rTg(tauwt) cultures than rTg(tauP301L) cultures. Four independent experiments consisting of 11 independent rTg(tauwt) cultures and 11 independent rTg(tauP301L) cultures are shown here (ANOVA: variation due to experiment F  = 5.5, P = .01; ANOVA mutant versus wild type F  = 65.9, P<0.0001. Interaction between experiment and tau genotype was marginally significant: F  = 3.8, P  = 0.035.) Following Bonferonni/Dunn correction, the mutant versus wild type comparison remained significant at P<0.0001. Paired t test also indicated a significant difference between rTg(tauP301L) and rTg(tauwt) neurospheres (P<0.0001). Closed circles represent tauwt; open circles represent tauP301L. (B, C) Fluorescence intensity histograms from Figure 3A’s Experiment 3 cells revealed heterogeneity in transgene expressing cells. Transgene positive cells were binned (1 to >10) based on fluorescence intensity. “1” indicates a “dim” cell with low transgene expression (open arrow from Figure 2), and bins 6 through >10 indicated “bright” cells with high transgene expression (closed arrow from Figure 2); proportion of cells is on the y-axis. The left-skewed rTg(tauwt) histogram (B) indicated that most Tau13-positive cells expressed human tau at low levels. In contrast, the bimodal rTg(tauP301L) histogram indicated two distinct cell populations: one comparable to rTg(tauwt) and one with higher transgene expression levels. TRE cell lines, TRE-tauP301L in this experiment, expressed human tau at low levels; all cells fell in bins 1 and 2.
Figure 4
Figure 4. Transgene-encoded human tauwt is more heavily phosphorylated than tauP301L.
(A) Electrophoresed and blotted neurosphere lysates were probed with antibodies against total tau (mouse and human): DA9; human tau: Tau13; phospho-tau: CP13, AT8, and PHF-1; and non-phospho tau: Tau1. In control samples, TRE (tauP301L shown here) and Tg(CK-tTA), all antibodies, except Tau13, revealed a mouse tau band at ∼52kDa that is absent from Mapt0/0 samples. Human tau from rTg samples migrated as a diffuse series of bands indicative of a heterogenous population of tau species. Human tauwt-expressing cells contained more slowly migrating tau species (∼53 to 60 kDa) than tauP301L-expressing cells (∼53 to 58 kDa) with all anti-tau antibodies, except Tau1, indicating a more heavily phosphorylated tau species in rTg(tauwt) than rTg(tauP301L). Tau1 probed samples revealed an identical migration pattern with both rTg genotypes. In all blots, MW lines indicate 60, 58, 53, 52 kDa, respectively. All samples probed with the each tau antibody were blotted on the same membrane. GAPDH was probed simultaneously with each tau antibody; the example of GAPDH immunostaining shown is taken from the Tau1 blot. Mapt0/0 and control samples were run on each blot but rearranged in the figure for presentation purposes. See Figures S1 for the original blots for each antibody showing the Mapt0/0 and control samples in their locations before rearrangement for presentation, along with GAPDH immunostaining for each blot. (B) Tau protein from rTg(tauwt) Mapt0/0 and rTg(tauP301L) Mapt0/0 neurosphere lysates had the same electrophoretic mobility after phosphatase treatment. Untreated samples (-) showed the characteristic slower migrating (∼60 kDa) trailing edge for tauwt compared to tauP301L. Calf-intestinal phosphatase (CIP) treatment (+) abolished the higher molecular weight phospho-tau bands (>52 kDa) leaving a single tau band migrating at ∼52kDa in both rTg genotypes. (C) Human tau from rTg(tauwt) E14 and adult mice contained more slowly migrating phospho-tau species than rTg(tauP301L) as seen in neurospheres. No immunoreactivity was observed in Mapt0/0 samples with any anti-tau antibody; *  =  mouse tau. All samples probed with each tau antibody were blotted on the same membrane. GAPDH was probed simultaneously with each tau antibody; the example of GAPDH immunostaining shown is taken from the AT8 blot. Mapt0/0 and control samples were run on each blot but rearranged in the figure for presentation purposes. See Figures S2 and S3 for complete, un-rearranged blots showing all samples that were run.
Figure 5
Figure 5. Overexpression of human tau did not interfere with localization of mouse tau to the nucleus in undifferentiated dividing cells.
IFA revealed a punctate nuclear tau species (arrow) immunoreactive to AT8 (A) but not CP13 (B) in dissociated undifferentiated neurospheres. AT8 immunoreactivity, indicative of pSer202/Thr205 tau, was seen in the nucleus of all genotypes that expressed mouse tau, but was absent in cultures derived from Mapt0/0 or in differentiated cells providing evidenced that it was of mouse origin and corresponded to actively dividing cells but not mature cell types.
Figure 6
Figure 6. Dissociated neurospheres stimulated with retinoic acid differentiated into cells that expressed neuronal or glial antigens.
Each rTg(tauP301L) (panel A) and rTg(tauwt) (panel B) culture contained cells positive for Tau13 and TUJ-1, Tau13 and Map2, and Tau13 and GFAP; merged images of Tau13 (red) with TUJ-1, Map2, or GFAP (green) are presented; yellow color indicates overlapping expression. Tg(CK-tTA) control cells are shown in panel C. Arrows point to spiny projections labeled with Map2 staining. Scale bar  = 10 µm. Cells were simultaneously stained with three different secondary antibodies (Alexa 546 α-mouse for Tau13; Alexa 647 α-rabbit for TUJ-1; Alexa 488 α-chicken for Map2) and each fluorophore was imaged in separate channels. Alexa 546 was artificially colored red, and Alexa 647 and 488 were both artificially colored green for color-combine with Tau13.
Figure 7
Figure 7. The proportion of differentiated cells that expressed human tau reflected that of undifferentiated neurospheres.
Differentiated cells immunoreactive with both Map2 and TUJ-1 antibodies were counted; the proportion co-expressing Tau13 is presented here. Presented are results from four independent rTg(tauwt) cultures and three independent rTg(tauP301L) cultures generated from two litters of each Tg(CK-tTA) × TRE-tau mating. The four litters were harvested, genotyped, and cultured simultaneous. They yielded four rTg(tauwt) and three rTg(tauP301L) pups for neurosphere culture shown here. By ANOVA, the proportions of differentiated cells (closed symbols) did not differ from those of the neurospheres (open symbols) (ANOVA, F = .008, P = .93). The different symbols represent individual cell lines before and after differentiation. Genotype had a highly significant effect even after Bonferroni correction (**: ANOVA, p<0.0001).
Figure 8
Figure 8. rTg(tauP301L) cells developed more filopodia-spines than differentiated rTg(tauwt) and non-transgene expressing control cells.
(A) Cells differentiated for 21 or 25 days were evaluated for the number of Map2 positive filopodia-spines and tau localization. Shown here are data pooled from three independent rTg(tauP301L) and four independent rTg(tauwt) lines. We observed transgenic tau expression, visualized by Tau13 immunoreactivity, throughout Map2 positive neurites and filopodia-spines in both tauP301L (top panel) and tauwt (bottom panel) expressing cells. Arrows point to filopodia-spines. Scale bar  = 10 µm. (B) The density, filopodia-spines/100 µm, was plotted for each genotype (n indicates number of cells counted). Time post-differentiation did not significantly affect spine density (ANOVA, F = 1.2, P = .28), but there was a significant interaction between genotype and time (F = 6.5, P = 0.0016) with spine density in rTg(tauP301L) neurospheres at 25 days significantly (**, P<.0001) greater than in rTg(tauwt) or TgCKtTA neurospheres. Overall the effect of genotype was highly significant (ANOVA, F = 13.3, P<0.001) The horizontal lines inside the boxes demarcate the mean filopodia-spine densities, circles indicate outliers; “n” indicates number of cells counted. (c) Plotting of spine density against fluorescence intensity revealed no correlation (R2 = 0.01) between protein expression level and filopodia-spine density. Closed circles represent rTg(tauwt) cells, open circles represent rTg(tauP301L) cells.

Comment in

References

    1. Cowan CA, Atienza J, Melton DA, Eggan K. Nuclear reprogramming of somatic cells after fusion with human embryonic stem cells. Science. 2005;309:1369–1373. - PubMed
    1. Takahashi K, Yamanaka S. Induction of pluripotent stem cells from mouse embryonic and adult fibroblast cultures by defined factors. Cell. 2006;126:663–676. - PubMed
    1. Shendelman S, Jonason A, Martinat C, Leete T, Abeliovich A. DJ-1 is a redox-dependent molecular chaperone that inhibits alpha-synuclein aggregate formation. PLoS Biol. 2004;2:e362. - PMC - PubMed
    1. Martinat C, Shendelman S, Jonason A, Leete T, Beal MF, et al. Sensitivity to oxidative stress in DJ-1-deficient dopamine neurons: an ES- derived cell model of primary Parkinsonism. PLoS Biol. 2004;2:e327. - PMC - PubMed
    1. Urbach A, Schuldiner M, Benvenisty N. Modeling for Lesch-Nyhan disease by gene targeting in human embryonic stem cells. Stem Cells. 2004;22:635–641. - PubMed

Publication types

MeSH terms

LinkOut - more resources