. 2012;7(6):e39359.
doi: 10.1371/journal.pone.0039359. Epub 2012 Jun 19.

Molecular effects of doxycycline treatment on pterygium as revealed by massive transcriptome sequencing

Affiliations

Molecular effects of doxycycline treatment on pterygium as revealed by massive transcriptome sequencing

Ignacio M Larráyoz et al. PLoS One. 2012.

Abstract

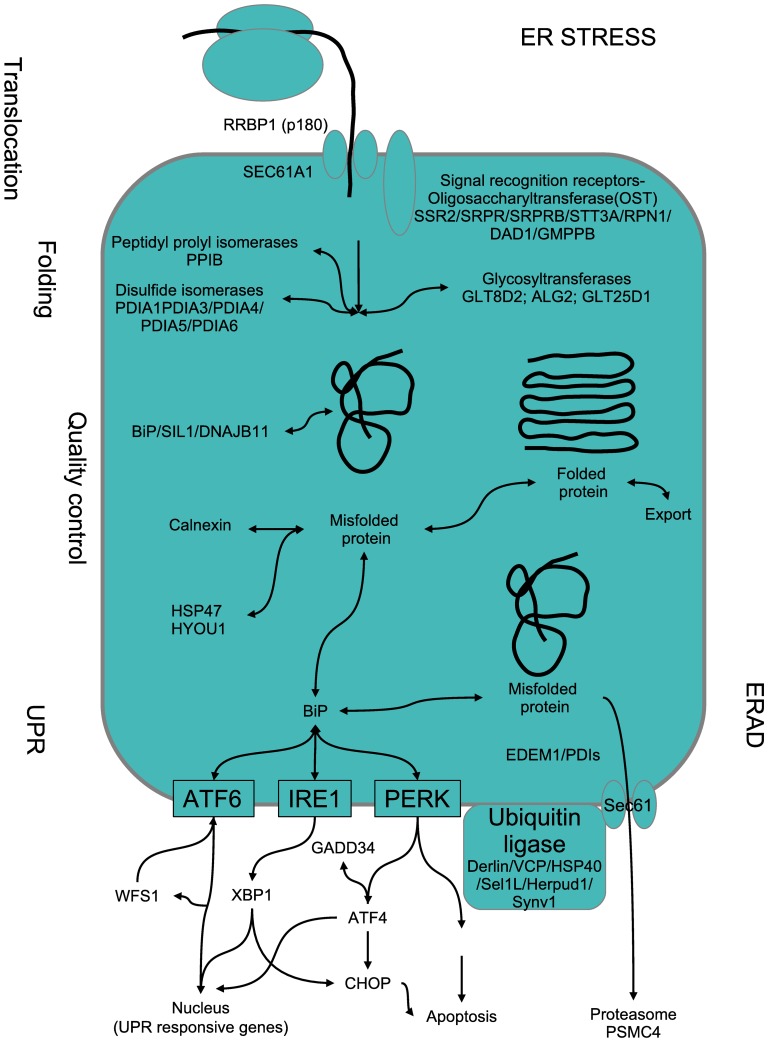
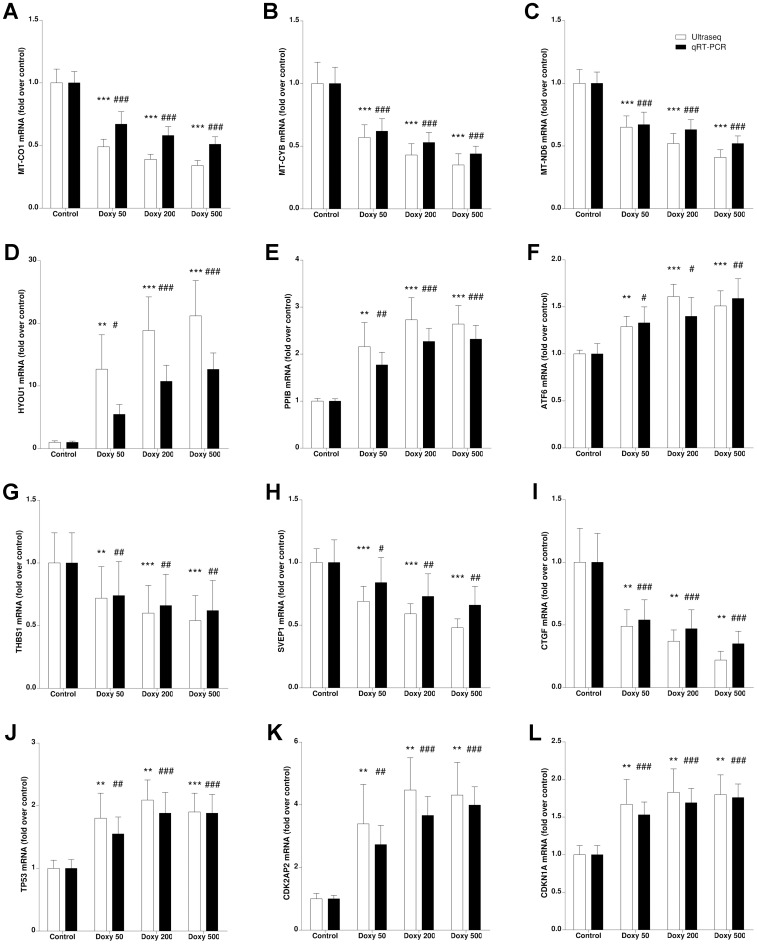
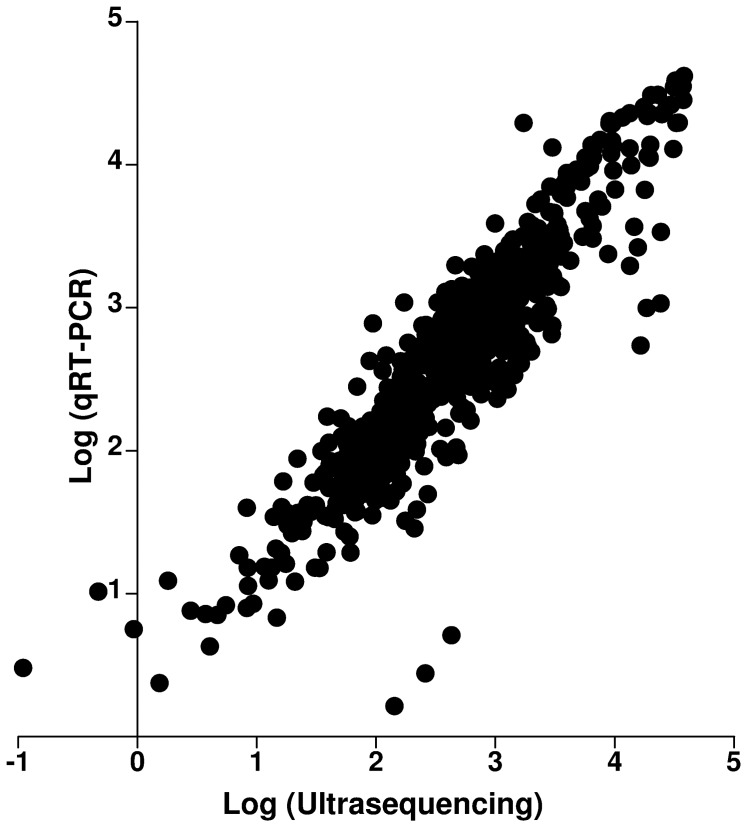
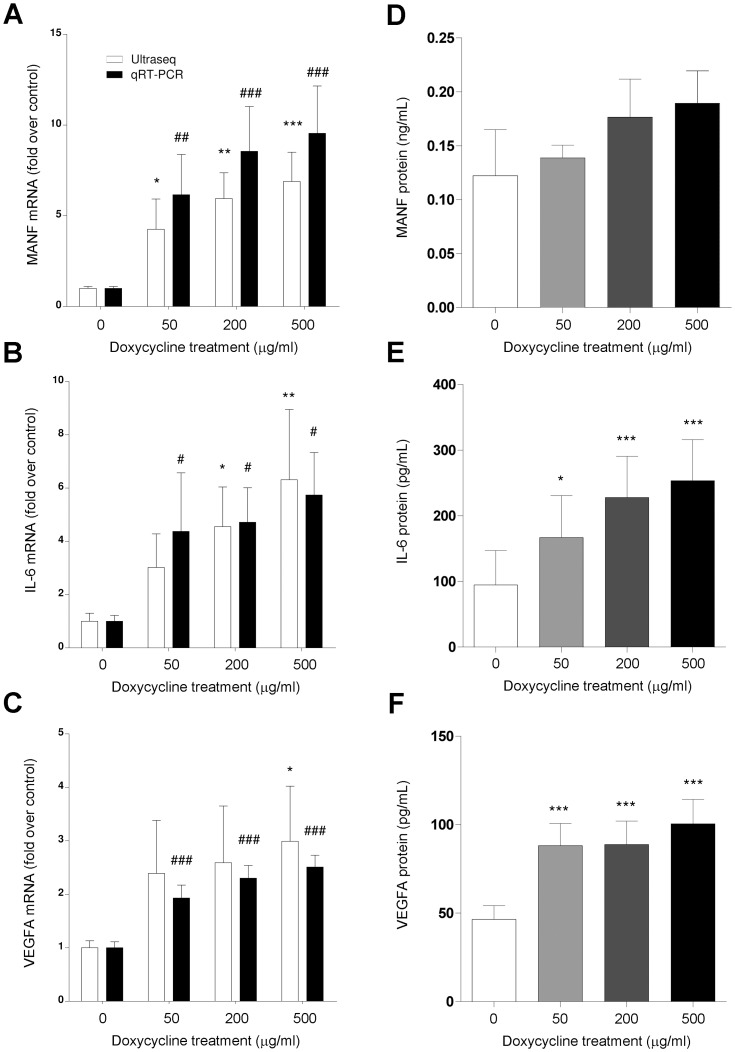
Pterygium is a lesion of the eye surface which involves cell proliferation, migration, angiogenesis, fibrosis, and extracellular matrix remodelling. Surgery is the only approved method to treat this disorder, but high recurrence rates are common. Recently, it has been shown in a mouse model that treatment with doxycycline resulted in reduction of the pterygium lesions. Here we study the mechanism(s) of action by which doxycycline achieves these results, using massive sequencing techniques. Surgically removed pterygia from 10 consecutive patients were set in short term culture and exposed to 0 (control), 50, 200, and 500 µg/ml doxycycline for 24 h, their mRNA was purified, reverse transcribed and sequenced through Illumina's massive sequencing protocols. Acquired data were subjected to quantile normalization and analyzed using cytoscape plugin software to explore the pathways involved. False discovery rate (FDR) methods were used to identify 332 genes which modified their expression in a dose-dependent manner upon exposure to doxycycline. The more represented cellular pathways included all mitochondrial genes, the endoplasmic reticulum stress response, integrins and extracellular matrix components, and growth factors. A high correlation was obtained when comparing ultrasequencing data with qRT-PCR and ELISA results. Doxycycline significantly modified the expression of important cellular pathways in pterygium cells, in a way which is consistent with the observed efficacy of this antibiotic to reduce pterygium lesions in a mouse model. Clinical trials are under way to demonstrate whether there is a benefit for human patients.


Conflict of interest statement

Competing Interests: The authors have declared that no competing interests exist.

Figures

Figure 1
Figure 1. Confocal image of pterygium cells in culture stained with antibodies against vimentin (green), CD31 (white), and keratin 4 (red).
DAPI was used as a nuclear counterstain (blue). All cells were vimentin-positive and no immunoreactivity was found for markers of epithelial or endothelial lineages. Bar = 20 µm.
Figure 2
Figure 2. Histogram showing the number of sequences aligned for each of the 40 experimental samples (sequencing depth).
Numbers represent individual donors and the 4 bars from each donor correspond to untreated control, and pterygium cells treated for 24 h with 50, 200, and 500 µg/ml doxycycline (left to right). There is a large variation in sequencing depth ranging from 82,040 reads for the less represented (cells from patient number 7, treated with 500 µg/ml doxycycline) to 7,653,010 reads for the best represented (cells from patient number 6, treated with 50 µg/ml doxycycline).
Figure 3
Figure 3. Experimental demonstration that a correct normalization protocol was applied to ultrasequencing data.
Representation of the expression levels in the Y chromosome in a male (A) and a female (B) patient. Each dark line represents expression of a particular exon along the length of the chromosome. The few lines observed in females correspond to repetitive regions of the genome. Expression levels for 3 representative genes: H19 (C,D), clusterin (E,F), and matrix metalloproteinase 2 (G,H) as they appear before (C,E,G) and after (D,F,H) application of our normalization protocol. Labeling of the 40 samples is the same as in Fig.1. Normalization success can be appreciated since individual variations are larger than treatment-induced changes in these genes.
Figure 4
Figure 4. Hierarchical clustering (Manhattan plot) of all samples (columns) and the 332 genes which experienced larger changes upon treatment with doxycycline (lines).
All the controls tend to cluster together (left hand side) indicating a good normalization technique. Red color expresses low expression levels and yellow designates high expression levels.
Figure 5
Figure 5. Schematic cartoon of the main pathways involved in the endoplasmic reticulum (ER) stress response.
Proteins are translocated directly from the ribosome into the ER and protein folding takes place with the help of specific chaperones. If folding is correct, the proteins follow their path to the Golgi complex and the secretory pathway. If misfolded proteins accumulate in the ER lumen, the UPR can be triggered and signals will be sent to the nucleus and apoptosis could be induced through CHOP. All the proteins represented in the cartoon are significantly upregulated by doxycycline treatment.
Figure 6
Figure 6. Gene expression quantification by ultrasequencing (open bars) and qRT-PCR (solid bars) for several sample genes involved in different pathways such as mitochondrial genes (A-C), endoplasmic reticulum stress response (D-F), members of the integrin family (G-I), and genes related with the cell cycle (J-L).
Bars represent fold increase (or decrease) with respect to untreated controls ± SEM for 10 independent samples. Statistically significant differences with untreated controls are represented by asterisks (for ultrasequencing data) or the pound sign (for qRT-PCR). **: p<0.01; ***: p<0.001; #: p<0.05; ##: p<0.01; ###: p<0.001.
Figure 7
Figure 7. Correlation analysis between values obtained through ultrasequencing (abscises) and through qRT-PCR (ordinates).
Pearsońs coefficient is 0.9110 and R2 = 0.8299; p<0.0001.
Figure 8
Figure 8. Correlation among values obtained through ultrasequencing, qRT-PCR, and ELISA for 3 secretory proteins whose expression varies with doxycycline treatment.
These include MANF (A,D), IL-6 (B,E), and VEGFA (C,F). For mRNA quantification (A,B,C), all bars represent fold increase with respect to untreated controls ± SEM for 10 independent samples. For protein quantification (D,E,F), bars represent the mean ± SEM for 10 independent samples. Statistically significant differences with untreated controls are represented by asterisks (for ultrasequencing and protein data) or the pound sign (for qRT-PCR). *: p<0.05; **: p<0.01; ***: p<0.001; #: p<0.05; ##: p<0.01; ###: p<0.001.

References

    1. Coroneo M. Ultraviolet radiation and the anterior eye. Eye Contact Lens 37: 214–224. 2011. 10.1097/ICL.0b013e318223394e [doi] - PubMed
    1. Bradley JC, Yang W, Bradley RH, Reid TW, Schwab IR. The science of pterygia. Br J Ophthalmol 94: 815–820. 2010. bjo.2008.151852 [pii];10.1136/bjo.2008.151852 [doi] - PubMed
    1. Chui J, Di GN, Wakefield D, Coroneo MT. The pathogenesis of pterygium: current concepts and their therapeutic implications. Ocul Surf. 2008;6:24–43. - PubMed
    1. Dzunic B, Jovanovic P, Veselinovic D, Petrovic A, Stefanovic I, et al. Analysis of pathohistological characteristics of pterygium. Bosn J Basic Med Sci. 2010;10:307–313. - PMC - PubMed
    1. Chui J, Coroneo MT, Tat LT, Crouch R, Wakefield D, et al. Ophthalmic pterygium: a stem cell disorder with premalignant features. Am J Pathol 178: 817–827. 2011. S0002-9440(10)00133-1 [pii];10.1016/j.ajpath.2010.10.037 [doi] - PMC - PubMed

Publication types