. 2012:2:233.
doi: 10.1038/srep00233. Epub 2012 Jan 25.

Impact of intestinal microbiota on intestinal luminal metabolome

Affiliations

Impact of intestinal microbiota on intestinal luminal metabolome

Mitsuharu Matsumoto et al. Sci Rep. 2012.

Abstract

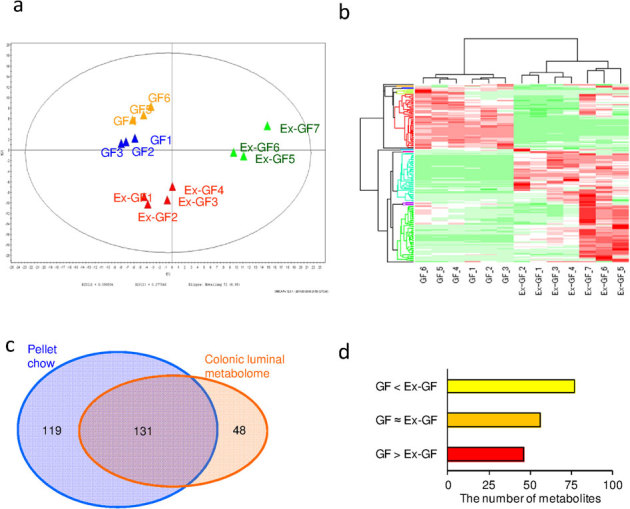
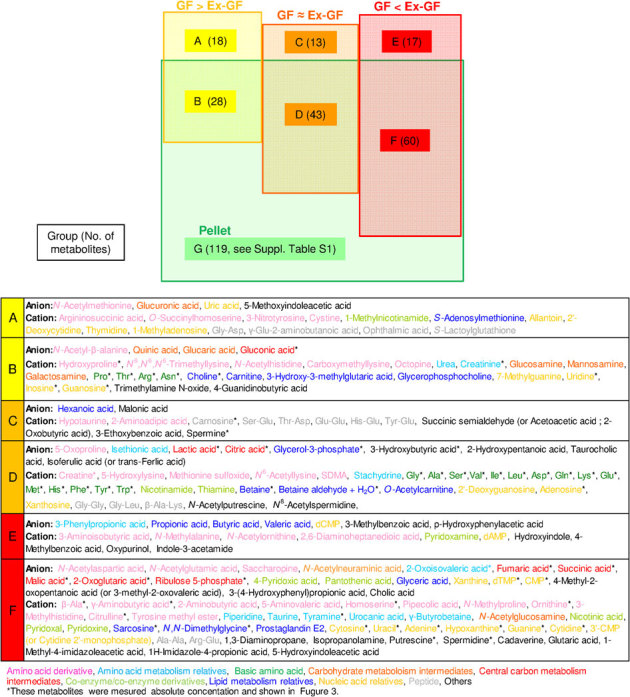
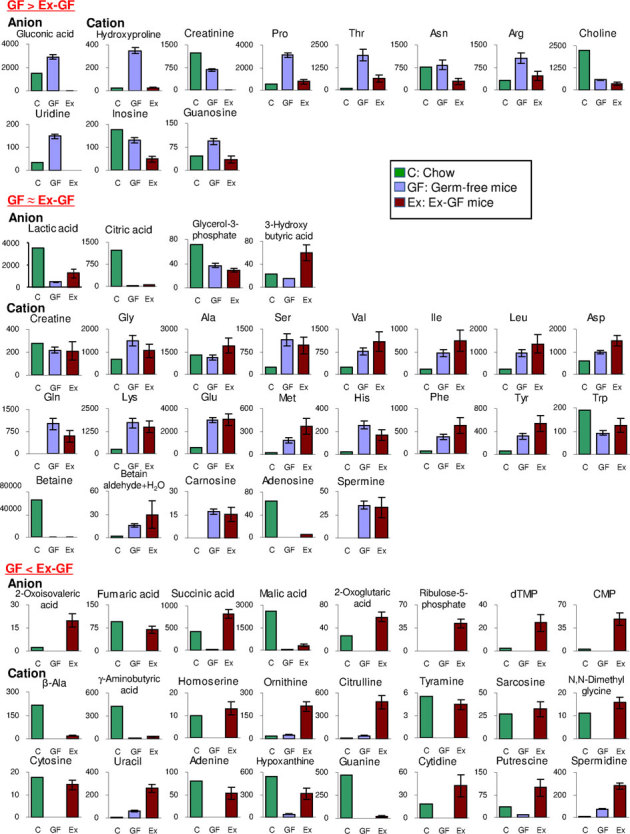
Low-molecular-weight metabolites produced by intestinal microbiota play a direct role in health and disease. In this study, we analyzed the colonic luminal metabolome using capillary electrophoresis mass spectrometry with time-of-flight (CE-TOFMS) -a novel technique for analyzing and differentially displaying metabolic profiles- in order to clarify the metabolite profiles in the intestinal lumen. CE-TOFMS identified 179 metabolites from the colonic luminal metabolome and 48 metabolites were present in significantly higher concentrations and/or incidence in the germ-free (GF) mice than in the Ex-GF mice (p < 0.05), 77 metabolites were present in significantly lower concentrations and/or incidence in the GF mice than in the Ex-GF mice (p < 0.05), and 56 metabolites showed no differences in the concentration or incidence between GF and Ex-GF mice. These indicate that intestinal microbiota highly influenced the colonic luminal metabolome and a comprehensive understanding of intestinal luminal metabolome is critical for clarifying host-intestinal bacterial interactions.


Conflict of interest statement

This work was supported by the Programme for Promotion of Basic and Applied Researches for Innovations in Bio-oriented Industry by the Bio-oriented Technology Research Advancement Institution (BRAIN), JAPAN. This work was funded by Kyodo Milk Industry Co. Ltd and Human Metabolome Technologies, Inc. The funders had no role in study design, data collection and analysis, decision to publish, or preparation of the manuscript. M. Matsumoto and E. Sawaki are employees of Kyodo Milk Industry Co. Ltd. and had a role in study design, data analysis, preparation of the manuscript, and decision to publish the manuscript. T. Ooga is employee of Human Metabolome Technologies, Inc. and had a role in data analysis and decision to publish the manuscript. All of the other authors declare that they have no conflict of interest.

Figures

Figure 1
Figure 1. The difference in the colonic metabolomes between GF mice and Ex-GF mice.
(a) PCA of the profiling data from the colonic metabolome. (b) Hierarchical clustering showing patterns of metabolites. Red and green indicate high and low concentrations of metabolites, respectively. (c) Venn diagram of the metabolites noted in the pellet and the colonic metabolome. (d) The number of colonic luminal metabolites in the group GF > Ex−GF, GF≈Ex−GF, and GF > Ex−GF.
Figure 2
Figure 2. Classification of metabolites detected from mice and pellets.
The metabolites in each group are classified as follows: (A) Metabolites produced by host and absorbed/hydrolyzed by colonic microbiota. (B) Metabolites produced by host or derived from pellet and absorbed/hydrolyzed by colonic microbiota. (C) Metabolites produced by host and not influenced by colonic microbiota. (D) Metabolites produced by host or derived from pellet and not influenced by colonic microbiota. (E) Metabolites produced by colonic microbiota. (F) Metabolites produced by colonic microbiota or derived from pellet and the absorption of which was possibly inhibited in the colon. (G) Ingredients in the pellet absorbed by the host.
Figure 3
Figure 3. Absolute quantitative comparison of metabolites in the pellet and the colonic lumen of GF mice and Ex-GF mice (nmol/g of feces).
Metabolites belonging to group GF > Ex−GF, GF ≈ Ex−GF, and GF < Ex−GF are shown in the upper, middle, and bottom panels, respectively. Data are represented as mean ± SEM. Estimated values of pellet ingredients in the colonic lumen are calculated as follows: Estimated values of ingredients (nmol/g) = measured concentration in pellet by CE-TOFMS/2.665 [ = pellet solid content (93.451%)/solid content of colonic content (33.06%)].
Figure 4
Figure 4. Colonic microbiota in GF mice and Ex−GF mice.
(a) PCA of the profiling data from colonic microbiota. (b) The dendrogram of the T-RFLP profiles of colonic microbiota from GF mice and Ex-GF mice. (c) The number of predominant bacterial genera and groups in the Ex-GF 1, 2, 3, and 4 (first sons) and Ex-GF 5, 6, and 7 (second sons) clusters.

References

    1. Qin J. et al. A human gut microbial gene catalogue established by metagenomic sequencing. Nature 464, 59–65 (2010). - PMC - PubMed
    1. Tannock G. W. Molecular analysis of the intestinal microflora in IBD. Mucosal Immunol 1 Suppl 1, S15–18 (2008). - PubMed
    1. Kirjavainen P. V., Arvola T., Salminen S. J. & Isolauri E. Aberrant composition of gut microbiota of allergic infants: a target of bifidobacterial therapy at weaning? Gut 51, 51–55 (2002). - PMC - PubMed
    1. Penders J., Stobberingh E. E., van den Brandt P. A. & Thijs C. The role of the intestinal microbiota in the development of atopic disorders. Allergy 62, 1223–1236 (2007). - PubMed
    1. Sobhani I. et al. Microbial Dysbiosis in Colorectal Cancer (CRC) Patients. PLoS One 6, e16393 (2011). - PMC - PubMed

Publication types