. 2012 May;2(5):120061.
doi: 10.1098/rsob.120061.

Massively parallel sequencing of the mouse exome to accurately identify rare, induced mutations: an immediate source for thousands of new mouse models

Affiliations

Massively parallel sequencing of the mouse exome to accurately identify rare, induced mutations: an immediate source for thousands of new mouse models

T D Andrews et al. Open Biol. 2012 May.

Abstract

Accurate identification of sparse heterozygous single-nucleotide variants (SNVs) is a critical challenge for identifying the causative mutations in mouse genetic screens, human genetic diseases and cancer. When seeking to identify causal DNA variants that occur at such low rates, they are overwhelmed by false-positive calls that arise from a range of technical and biological sources. We describe a strategy using whole-exome capture, massively parallel DNA sequencing and computational analysis, which identifies with a low false-positive rate the majority of heterozygous and homozygous SNVs arising de novo with a frequency of one nucleotide substitution per megabase in progeny of N-ethyl-N-nitrosourea (ENU)-mutated C57BL/6j mice. We found that by applying a strategy of filtering raw SNV calls against known and platform-specific variants we could call true SNVs with a false-positive rate of 19.4 per cent and an estimated false-negative rate of 21.3 per cent. These error rates are small enough to enable calling a causative mutation from both homozygous and heterozygous candidate mutation lists with little or no further experimental validation. The efficacy of this approach is demonstrated by identifying the causative mutation in the Ptprc gene in a lymphocyte-deficient strain and in 11 other strains with immune disorders or obesity, without the need for meiotic mapping. Exome sequencing of first-generation mutant mice revealed hundreds of unphenotyped protein-changing mutations, 52 per cent of which are predicted to be deleterious, which now become available for breeding and experimental analysis. We show that exome sequencing data alone are sufficient to identify induced mutations. This approach transforms genetic screens in mice, establishes a general strategy for analysing rare DNA variants and opens up a large new source for experimental models of human disease.

Keywords: DNA capture; N-ethyl-N-nitrosourea mutagenesis; exome sequencing; mouse; mutation detection; variation detection.


Figures

Figure 1.
Figure 1.
Summary of the structure of ENU-mutated mouse pedigrees. Each pedigree is initiated by two unrelated G1 founders. Each of these founders inherits a random set of de novo point mutations (coloured circles) on the paternal chromosomes, induced by ENU treatment of their male parent. These G1 founders will carry on average one to two DNA variants per Mb and 90 exonic ENU-induced mutations. Second-generation (G2) progeny of these mice inherit a theoretical 45 ENU-induced exonic mutations, all of which are carried in the heterozygous state. Two productive sibling–sibling matings of the G2 mice result in third-generation (G3) progeny that carry approximately 94% of the founding ENU-induced, protein-coding mutations, of which on average five are homozygous in any given mouse.
Figure 2.
Figure 2.
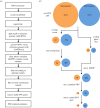
Workflow and filtering strategy used to identify de novo protein-changing mutations. (a) Following DNA extraction, exome enrichment and sequencing, reads were aligned to the mouse reference genome [15] using BWA [16] and variation between the two genomes identified using SAMTools [17]. The set of raw SNVs was subsequently filtered to annotate known variation and other apparent SNVs known not to be ENU-induced. SNVs were further filtered to annotate those that fell within coding regions (or adjacent splice donor/acceptor sites) and were non-synonymous changes. Finally, as ENU treatment is known to introduce a uniform genomic distribution of mutations, genes that contained multiple SNVs were filtered from the final set of variants. (b) Using this cumulative filtering strategy against a single replicate exome sequence of the nimbus mouse, the initial 8723 variant calls reduced to a final set of three homozygous and 39 heterozygous putative mutations. Circles representing homozygous and heterozygous SNV numbers are coloured orange and blue, respectively.
Figure 3.
Figure 3.
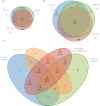
Sensitivity and specificity of mutation detection in the nimbus mutant mouse pedigree assessed through technical and biological replicate datasets. Venn diagrams of overlap of filtered variant calls between three technical replicate exome sequence datasets, showing putative (a) homozygous and (b) heterozygous ENU-induced mutations. The red, green and blue circles each indicate separate technical replicates, and the coloured numbers associated with each denote the total number of variants called in each dataset. Upper numbers within each sector show the number of filter-passing SNVs called in one, two or all three technical replicates. The numbers below show the fraction of these SNVs that were validated as true mutations by independent, custom, SNV-specific PCR assays. The denominator in each case is the number of SNVs where an SNV-specific PCR assay was established successfully. (c) Overlap of filtered variant calls from a set of four biological replicates, representing two parental G2 nimbus mice and two of their G3 offspring. One of the G3 offspring (labelled G3 proband) is the same mouse as that sequenced in the technical replicates shown in (a) and (b). The variant numbers shown for this mouse are pooled values from the three technical replicates. Both G2 nimbus mice and the sibling of the G3 proband (labelled G3 sibling) are unaffected by the lymphopaenia phenotype. Upper numbers within each sector of the four-way Venn diagram show the total number of filter-passing heterozygous and homozygous SNVs called in one or more of the replicates from this pedigree. The numbers immediately below show the fractions of biologically replicated SNVs that were validated as true mutations by independent, custom, SNV-specific PCR assays. In the case of technically replicated data from the proband (the red circle), the third line of data in each region of overlap shows the number of times a variant was seen in one, two or three replicates (formatted as: single count, double count and triple count).
Figure 4.
Figure 4.
The influence of sequence quality scores and read depth on the identification of true-positive and false-positive SNVs. (a) False-positive calls with respect to read depth and quality score, shown for a single exome dataset generated from the G3 nimbus mouse (technical replicate 1 from figure 3). Variant calls on this dataset were compared with the PCR-validated true-positive and false-positive SNVs called in the technical replicate exome datasets of the G3 nimbus proband. Green and red points are true- and false-positive SNV calls, respectively. The distribution of read depth frequencies over all exonic bases is indicated by the red line in the top graph. The red bars in the right-hand graph indicate the distribution of quality scores also ascertained for all exonic bases. (b) Results of simulation experiment performed to generate random subsets of a single exome dataset, being one of the triplicate exome runs for the nimbus proband (technical replicate 1). The panel shows tallies of true-positive heterozygous (green), false-positive heterozygous (red), true-positive homozygous (blue) and false-positive homozygous (grey) SNV calls plotted against the number of input reads, which are incremental proportions of an Illumina GAIIx lane. Numbers alongside the green dots indicate the median read depth determined for each true-positive data point. Plotted above are the proportions of the exome covered at 20× depth or better for each proportion of the input read set.
Figure 5.
Figure 5.
Nimbus results from a loss of function mutation in the Ptprc gene. (a) Schematic diagram showing the location of single nucleotide mutation at Chr1:139986183 at the +1 intronic position of the exon 17 splice donor sequence and the location of the corresponding region in the encoded CD45 protein (TM, transmembrane domain; FNIII, fibronectin III-like domain; PTP, protein tyrosine phosphatase). (b) Loss of CD45 protein expression. Bold black lines show flow cytometric staining with antibody to the B-cell-specific CD45R isoform on IgM+, IgD+ B lymphocytes in blood from (i) Ptprc+/+ wild-type (wt), (ii) Ptprcnimbus/+ heterozygous or (iii) Ptprcnimbus/nimbus homozygous mouse, compared with negative control staining on CD3+ T cells in the same mouse (thin black line) and compared with positive control staining with the same antibody on B cells in a wt mouse (grey shaded area).
Figure 6.
Figure 6.
Violin plot comparing PolyPhen2 scores for incidental and causative mutations. The black bars represent a boxplot where 50% of values lie within the main bar. The white dot indicates the median polyphen value for each set of scores. The blue region is a kernel density plot representing the distribution of PolyPhen2 scores. The numbers of mutations included in the plot were: incidental mutations, n = 325 and causative mutations, n = 40. A Mann–Whitney test for the equality of the mean PolyPhen2 score of the incidental and causative mutations indicated a significant difference in score (W = 4168, p = 0.0000862).

References

    1. Acevedo-Arozena A, Wells S, Potter P, Kelly M, Cox RD, Brown SDM. 2008. ENU mutagenesis, a way forward to understand gene function. Annu. Rev. Genomics Hum. Genet. 9, 49–6910.1146/annurev.genom.9.081307.164224 (doi:10.1146/annurev.genom.9.081307.164224) - DOI - DOI - PubMed
    1. Justice MJ, Noveroske JK, Weber JS, Zheng B, Bradley A. 1999. Mouse ENU mutagenesis. Hum. Mol. Genet. 8, 1955–196310.1093/hmg/8.10.1955 (doi:10.1093/hmg/8.10.1955) - DOI - DOI - PubMed
    1. Albert TJ, et al. 2007. Direct selection of human genomic loci by microarray hybridization. Nat. Methods 4, 903–90510.1038/nmeth1111 (doi:10.1038/nmeth1111) - DOI - DOI - PubMed
    1. Gnirke A, et al. 2009. Solution hybrid selection with ultra-long oligonucleotides for massively parallel targeted sequencing. Nat. Biotechnol. 27, 182–18910.1038/nbt.1523 (doi:10.1038/nbt.1523) - DOI - DOI - PMC - PubMed
    1. Ng SB, Nickerson DA, Bamshad MJ, Shendure J. 2010. Massively parallel sequencing and rare disease. Hum. Mol. Genet. 19, R119–R12410.1093/hmg/ddq390 (doi:10.1093/hmg/ddq390) - DOI - DOI - PMC - PubMed

Publication types

LinkOut - more resources