

Prevalence of alcohol and other drugs in fatally injured drivers
- PMID: 22725100
- PMCID: PMC3467360
- DOI: 10.1111/j.1360-0443.2012.03993.x
Prevalence of alcohol and other drugs in fatally injured drivers
Abstract
Aim: This study aims to examine the prevalence of alcohol and/or other drugs (AOD) in a large sample of fatally injured drivers.
Design: Using data from the Fatality Analysis Reporting System for 2005-09, the authors examined the prevalence of AOD detected in fatally injured drivers in the United States.
Setting: Fatal motor vehicle crashes occurring on public roads.
Participants: Drivers who died within 1 hour of the crash in 14 states that performed toxicological testing on more than 80% of these drivers.
Measurements: The prevalence of AOD and multivariable-adjusted prevalence ratios (aPR).
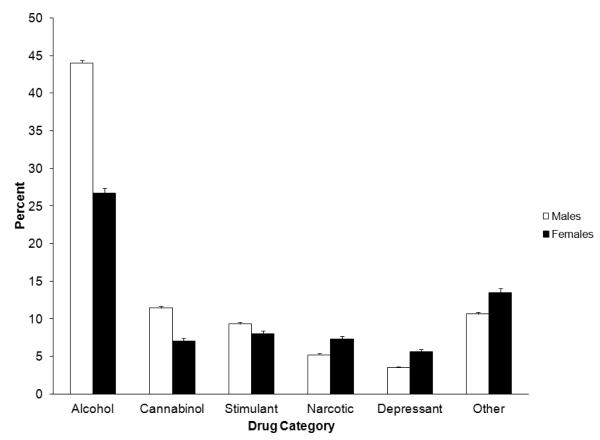
Findings: Of the 20,150 fatally injured drivers studied, 57.3% tested positive for AOD, including 19.9% being positive for two or more substances. Alcohol was the most commonly detected substance, present in 40.2% of the fatally injured drivers, followed by cannabinols (10.5%), stimulants (9.0%), narcotics (5.7%) and depressants (4.0%). Multivariable analysis revealed that AOD was significantly more prevalent among drivers who died in single-vehicle crashes [aPR 1.69, 95% confidence interval (CI): 1.62-1.76] or night-time crashes (aPR 1.43, 95% CI: 1.39-1.47), or who had a driving-while-intoxicated conviction within the past 3 years (aPR 1.41, 95% CI: 1.35-1.47), and less prevalent among drivers who were 65 years or older (aPR 0.45, 95% CI: 0.42-0.49), Asian (aPR 0.47, 95% CI 0.41-0.53) or female (aPR 0.88, 95% CI: 0.85-0.91) or who were operating a motor carrier (aPR 0.41, 95% CI 0.34-0.48).
Conclusions: More than half of fatally injured drivers in the United States had been using AOD and approximately 20% had been using polydrugs. The prevalence of AOD use varies significantly with driver and crash characteristics.
© 2012 The Authors, Addiction © 2012 Society for the Study of Addiction.
Figures
References
-
- Goodnough A, Zezima K. Drivers on prescription drugs are hard to convict. The New York Times. 2010 Jul 25;:A1.
-
- Baker A, Foderaro LW. Tests Show Driver was Drunk in Parkway Crash That Killed 8. The New York Times. 2009 Aug 4;:A1.
-
- National Institute on Drug Abuse . Drugged driving. National Institute on Drug Abuse, National Institutes of Health, US Department of Health & Human Services; Bethesda, MD: [Accessed November 10, 2011]. 2010. Available at: http://www.nida.nih.gov/infofacts/driving.html. Archived at: http://www.webcitation.org/63692Otpq.
-
- Walsh JM, DuPont RL. The Drugged Driving Epidemic. The Washington Post. 2007 Jun 17;
-
- McCarthy ML. Prescription drug abuse up sharply in the USA. Lancet. 2007;369(9572):1505–6. - PubMed
Publication types
MeSH terms
Grants and funding
LinkOut - more resources
Full Text Sources
Medical
Miscellaneous
