

Enrichment and detection of rare proteins with aptamer-conjugated gold nanorods
- PMID: 22725611
- PMCID: PMC3407574
- DOI: 10.1021/ac300806s
Enrichment and detection of rare proteins with aptamer-conjugated gold nanorods
Abstract
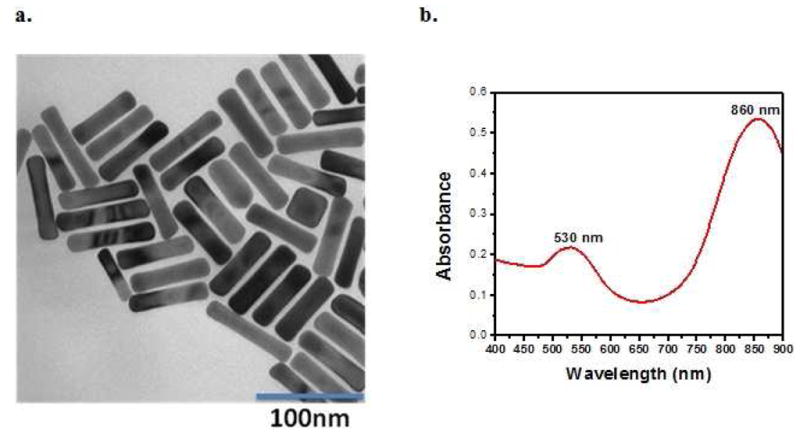
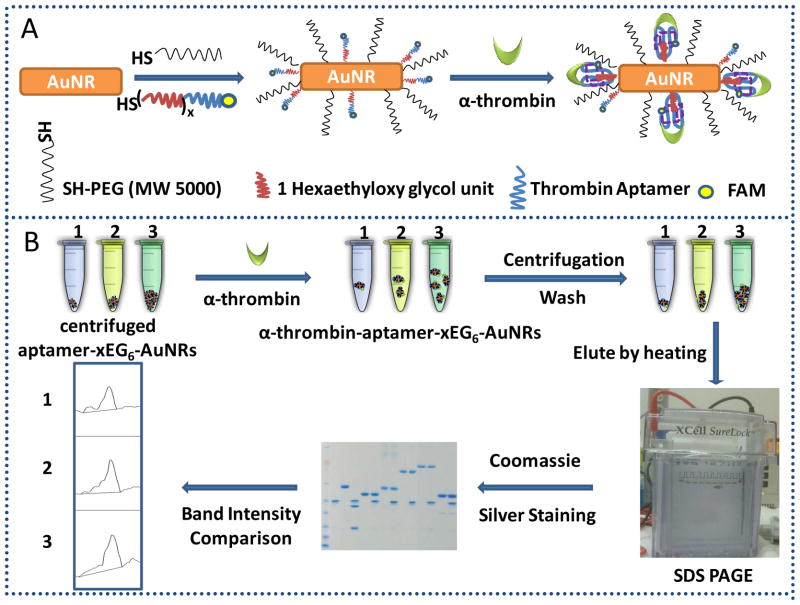
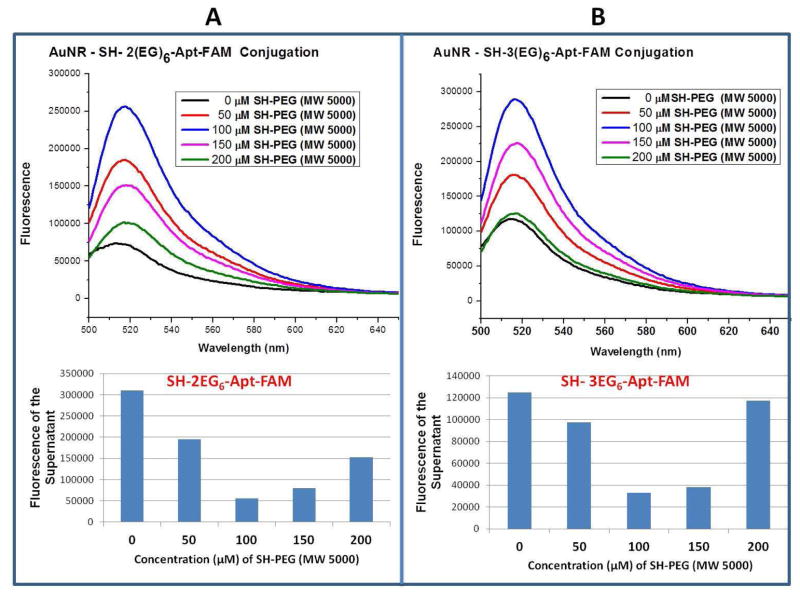
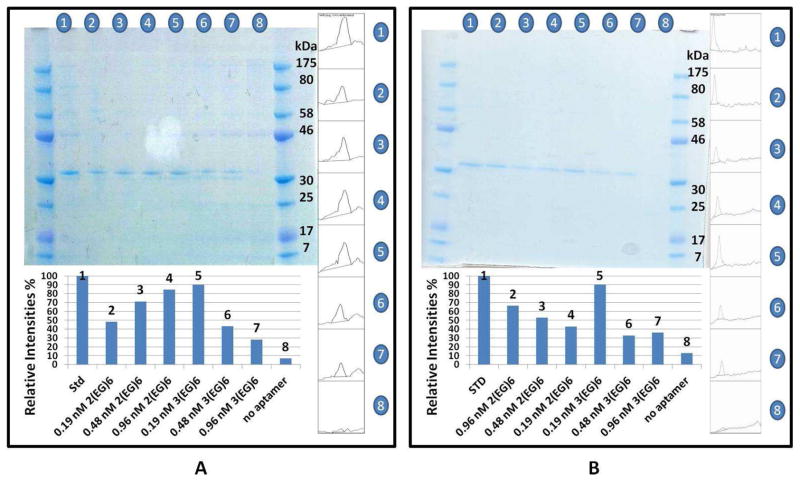
Rare protein enrichment and sensitive detection hold great potential in biomedical studies and clinical practice. This work describes the use of aptamer-conjugated gold nanorods for the efficient enrichment of rare proteins from buffer solutions and human plasma. Gold nanorod (AuNR) surfaces were modified with a long PEG chain and a 15-mer thrombin aptamer for protein enrichment and detection. Studies of the effect of surface modification on enrichment efficiency of thrombin showed that a change of only one EG(6) linker unit, i.e., from 2EG(6) to 3EG(6), could increase thrombin protein capture efficiency by up to 47%. Furthermore, a 1 ppm sample of thrombin in buffer could be enriched with around 90% efficiency using a low concentration (0.19 nM) of gold nanorod probe modified with 3EG(6) spacer, and with the same probe, effective capture was achieved down to 10 ppb (1 ng) thrombin in plasma samples. In addition to α-thrombin enrichment, prothrombin was also efficiently captured from plasma samples via gold nanorods conjugated with 15-mer thrombin aptamer. Our work demonstrates efficient enrichment of rare proteins using aptamer-modified nanomaterials, which can be used in biomarker discovery studies.
Figures
Similar articles
-
Reversible regulation of thrombin adsorption and desorption based on photoresponsive-aptamer modified gold nanoparticles.Talanta. 2015 Nov 1;144:312-7. doi: 10.1016/j.talanta.2015.06.053. Epub 2015 Jun 24. Talanta. 2015. PMID: 26452827
-
An aptamer-based assay for thrombin via structure switch based on gold nanoparticles and magnetic nanoparticles.Talanta. 2010 Mar 15;80(5):1868-72. doi: 10.1016/j.talanta.2009.10.036. Epub 2009 Oct 28. Talanta. 2010. PMID: 20152425
-
Surface plasmon resonance spectroscopy study of interfacial binding of thrombin to antithrombin DNA aptamers.J Colloid Interface Sci. 2007 Nov 1;315(1):99-106. doi: 10.1016/j.jcis.2007.06.040. Epub 2007 Aug 8. J Colloid Interface Sci. 2007. PMID: 17689549
-
Nanostructure shape effects on response of plasmonic aptamer sensors.J Mol Recognit. 2013 Sep;26(9):402-7. doi: 10.1002/jmr.2278. J Mol Recognit. 2013. PMID: 23836467
-
A review of aptamer-conjugated nanomaterials for analytical sample preparation: Classification according to the utilized nanomaterials.Anal Chim Acta. 2024 Jan 25;1287:342001. doi: 10.1016/j.aca.2023.342001. Epub 2023 Nov 7. Anal Chim Acta. 2024. PMID: 38182359 Review.
Cited by
-
BSA modification to reduce CTAB induced nonspecificity and cytotoxicity of aptamer-conjugated gold nanorods.Nanoscale. 2015 Jun 14;7(22):10240-8. doi: 10.1039/c5nr01704a. Epub 2015 May 20. Nanoscale. 2015. PMID: 25990591 Free PMC article.
-
Cancer cell sensing and therapy using affinity tag-conjugated gold nanorods.Interface Focus. 2013 Jun 6;3(3):20130006. doi: 10.1098/rsfs.2013.0006. Interface Focus. 2013. PMID: 24427543 Free PMC article. Review.
-
Aptamer-conjugated multifunctional nanoflowers as a platform for targeting, capture, and detection in laser desorption ionization mass spectrometry.ACS Nano. 2013 Jan 22;7(1):417-27. doi: 10.1021/nn304458m. Epub 2012 Dec 13. ACS Nano. 2013. PMID: 23211039 Free PMC article.
-
A cell-targeted, size-photocontrollable, nuclear-uptake nanodrug delivery system for drug-resistant cancer therapy.Nano Lett. 2015 Jan 14;15(1):457-63. doi: 10.1021/nl503777s. Epub 2014 Dec 12. Nano Lett. 2015. PMID: 25479133 Free PMC article.
-
Electrokinetic Mixing for Improving the Kinetics of an HbA1c Immunoassay.Sci Rep. 2019 Dec 27;9(1):19885. doi: 10.1038/s41598-019-56205-4. Sci Rep. 2019. PMID: 31882622 Free PMC article.
References
Publication types
MeSH terms
Substances
Grants and funding
LinkOut - more resources
Full Text Sources
Other Literature Sources
Miscellaneous
