. 2012 Jul 3;84(13):5787-93.
doi: 10.1021/ac301137c. Epub 2012 Jun 22.

Biodegradable optode-based nanosensors for in vivo monitoring

Affiliations

Biodegradable optode-based nanosensors for in vivo monitoring

Mary K Balaconis et al. Anal Chem. .

Abstract

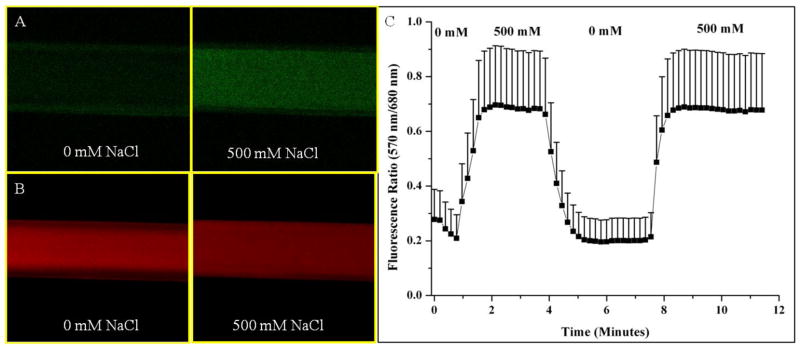
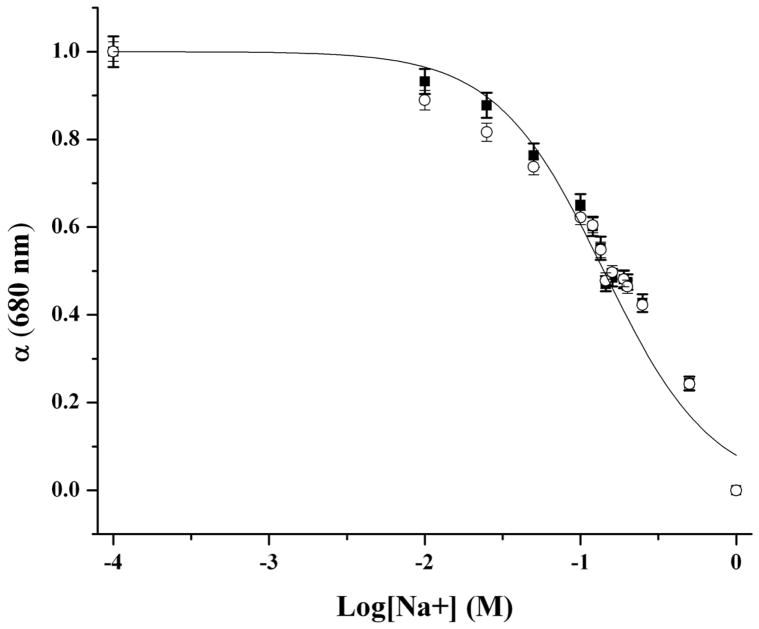
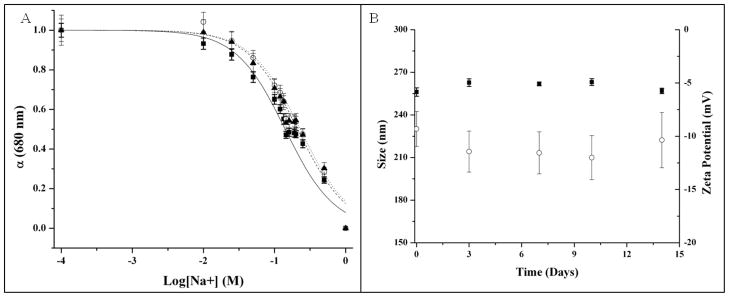
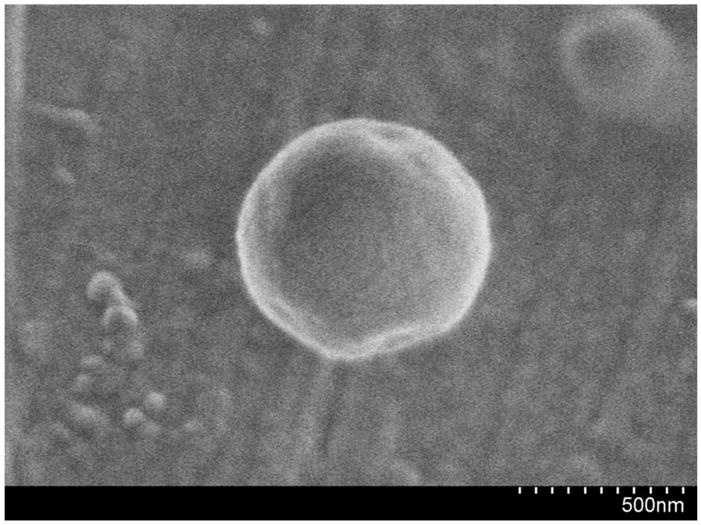
Optode-based fluorescent nanosensors are being developed for monitoring important disease states such as hyponatremia and diabetes. However, traditional optode-based sensors are composed of nonbiodegradable polymers such as poly(vinyl chloride) (PVC) raising toxicity concerns for long-term in vivo use. Here, we report the development of the first biodegradable optode-based nanosensors that maintain sensing characteristics similar to those of traditional optode sensors. The polymer matrix of these sensors is composed of polycaprolactone (PCL) and a citric acid ester plasticizer. The PCL-based nanosensors yielded a dynamic and reversible response to sodium, were tuned to respond to extracellular sodium concentrations, and had a lifetime of at least 14 days at physiological temperature. When in the presence of lipase, the nanosensors degraded within 4 h at lipase concentrations found in the liver but were present after 3 days at lipase concentrations found in serum. The development of biodegradable nanosensors is not only a positive step towards their future use in in vivo applications, but they also represent a new sensor platform that can be extended to other sensing mechanisms.


Figures

Figure 1
Figure 1
Fluorescence reversibility of biodegradable sodium nanosensors. Fluorescent confocal images of nanosensors in hollow fiber dialysis tubing at (A) 570 nm emission and (B) 680 nm emission for one set of nanosensors. (C) Reversibility of sodium nanosensors for two cycles. Emission intensities at 570 nm and 680 nm were ratioed at each time point. Error bars represent standard deviations from 3 individual sets of sodium nanosensors. Positive error bars are shown here for clarity, but error has a symmetrical distribution around the mean. Note: A ratio of fluorescence intensities is displayed instead of α.
Figure 2
Figure 2
Response curves of biodegradable sodium nanosensors with no interferent (■) and with 15 mM KCl background interferent solution (○). There was no significant change in response of the nanosensors to sodium while in the presence of KCl (p > 0.01). Measurements were taken in triplicate for three different sets of nanosensors (n=9). Error bars were calculated using the laws of error propagation.
Figure 3
Figure 3
Lifetime and stability of biodegradable sodium nanosensors. (A) Response curves on Day 0 (—■—), Day 7 (--○--), and Day 14 (···▲···). Measurements were taken in triplicate for three different sets of nanosensors (n=9) and error bars were calculated using the laws of error propagation. (B) Average sizes (■) and zeta potentials (○) measured intermittently over the course of two weeks. Three samples were run from three individual sets of nanosensors. For each sample of nanosensors, 3 size measurements were made and five zeta potential measurements were made. Therefore, n=27 for size measurements and n=45 for zeta potential measurements. Error bars were calculated using the laws of error propagation.
Figure 4
Figure 4
SEM micrograph of a biodegradable sodium nanosensor.
Figure 5
Figure 5
Degradation profiles of sodium nanosensors composed of 100% PCL (■, □), 100% Citroflex A-6 (●,○), and 2:1 Citroflex A-6 to PCL (▲, △). Decreases in both fluorescence intensity (—, solid objects) and count rate (- - -, open objects) were used to assess degradation of sodium nanosensors while in the presence of (A) no lipase, (B) low serum concentrations of lipase (30 U/L), (C) high serum concentrations of lipase (190 U/L), and (D) liver lipase concentration (6,000 U/L). Averages of fluorescence intensity (n=6) and count rate (n=9) are shown with error bars calculated using the laws of error propagation.

References

    1. Seiler K, Wang K, Bakker E, Morf WE, Rusterholz B, Spichiger UE, Simon W. Clin Chem (Washington, DC, US) 1991;37(8):1350–5. - PubMed
    1. Wang K, Seiler K, Morf WE, Spichiger UE, Simon W, Lindner E, Pungor E. Anal Sci. 1990;6(5):715.
    1. Morf WE, Seiler K, Rusterholz B, Simon W. Anal Chem (Washington, DC, US) 1990;62(7):738–742.
    1. Trettnak W, Wolfbeis OS. Anal Chim Acta. 1989;221(0):195–203.
    1. Balaconis MK, Billingsley K, Dubach MJ, Cash KJ, Clark HA. Journal of Diabetes Science and Technology. 2011;5(1):68–75. - PMC - PubMed

Publication types

MeSH terms