. 2012 Jun 22;149(7):1622-34.
doi: 10.1016/j.cell.2012.04.041.

Expressed pseudogenes in the transcriptional landscape of human cancers

Affiliations

Expressed pseudogenes in the transcriptional landscape of human cancers

Shanker Kalyana-Sundaram et al. Cell. .

Abstract

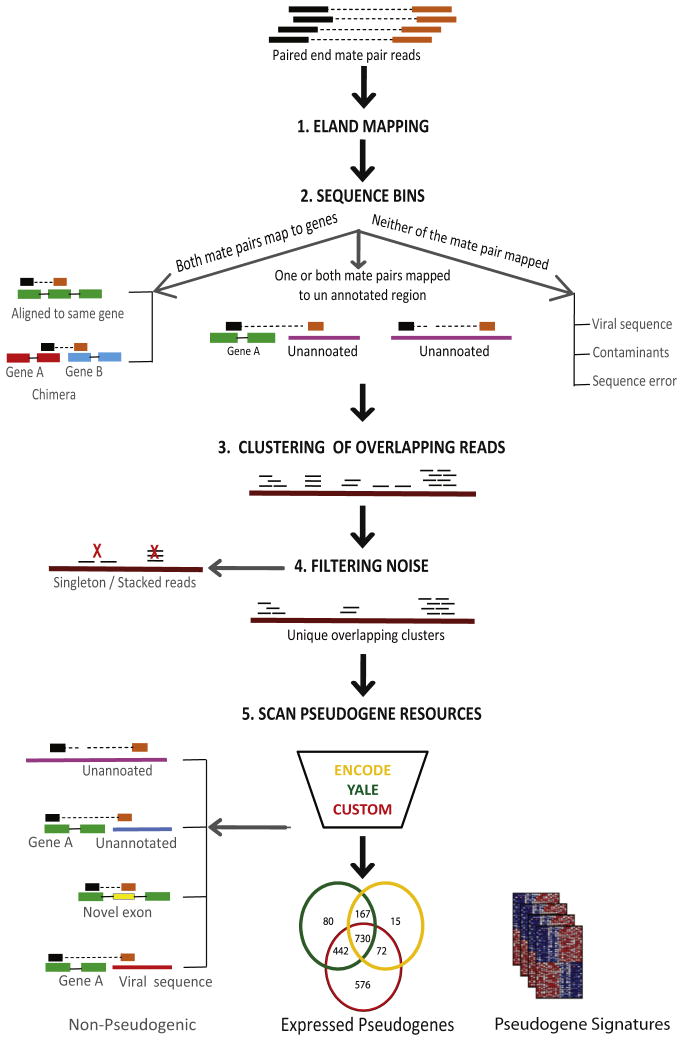
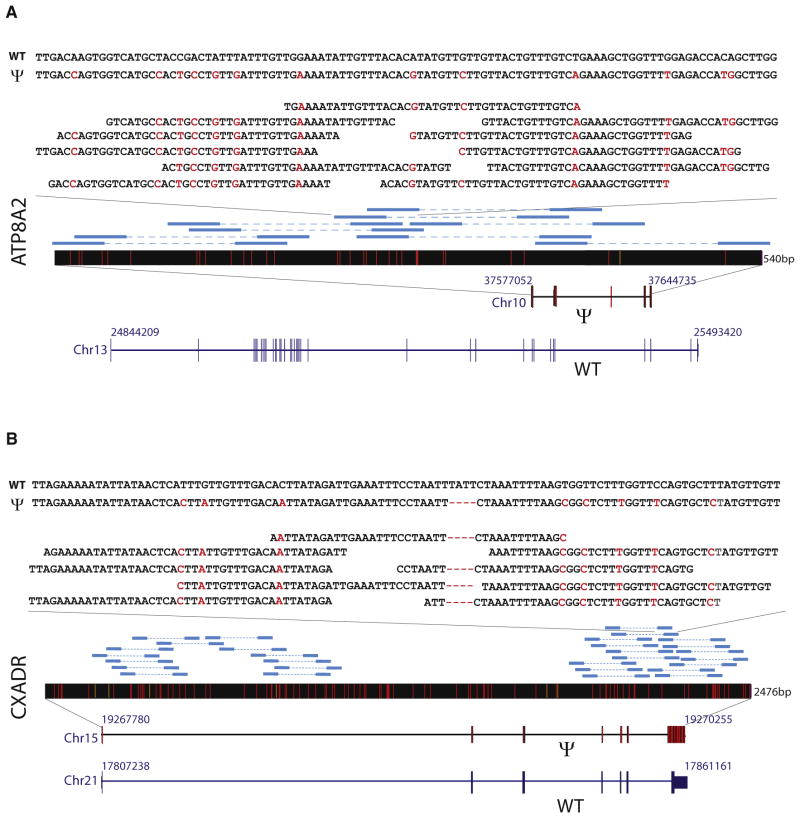
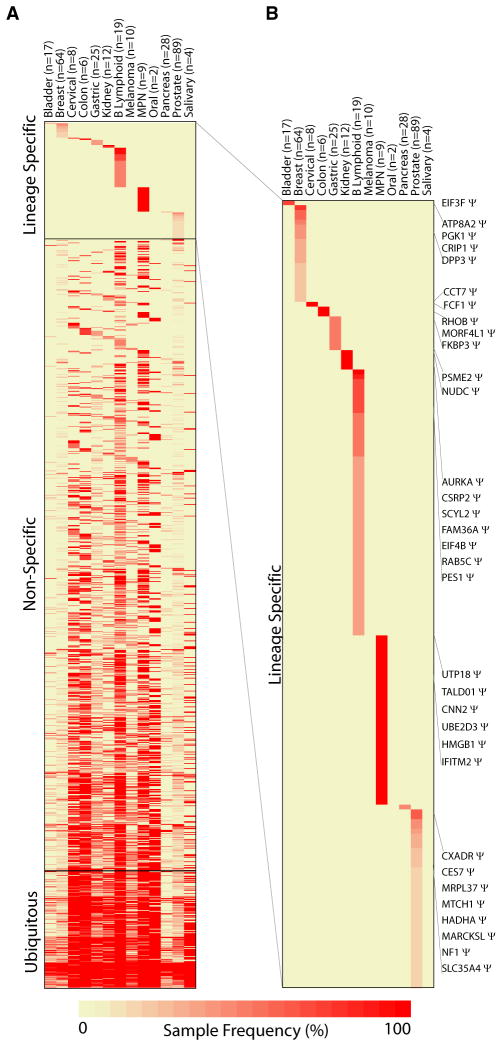
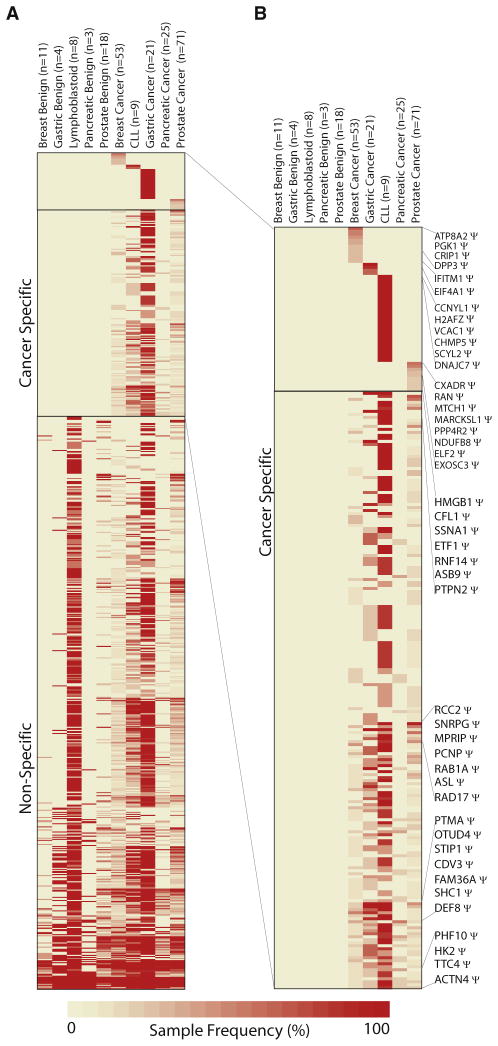
Pseudogene transcripts can provide a novel tier of gene regulation through generation of endogenous siRNAs or miRNA-binding sites. Characterization of pseudogene expression, however, has remained confined to anecdotal observations due to analytical challenges posed by the extremely close sequence similarity with their counterpart coding genes. Here, we describe a systematic analysis of pseudogene "transcription" from an RNA-Seq resource of 293 samples, representing 13 cancer and normal tissue types, and observe a surprisingly prevalent, genome-wide expression of pseudogenes that could be categorized as ubiquitously expressed or lineage and/or cancer specific. Further, we explore disease subtype specificity and functions of selected expressed pseudogenes. Taken together, we provide evidence that transcribed pseudogenes are a significant contributor to the transcriptional landscape of cells and are positioned to play significant roles in cellular differentiation and cancer progression, especially in light of the recently described ceRNA networks. Our work provides a transcriptome resource that enables high-throughput analyses of pseudogene expression.


Figures

Figure 1
Figure 1. Pseudogene Expression Analysis Pipeline
The bioinformatics pipeline for analyzing pseudo-gene transcription involved the following steps: (1) Paired-end transcriptome sequencing reads were mapped to the human genome and UCSC Genes using ELAND. (2) Passed purity (PF) filter reads were assigned into three sequence bins as indicated. (3) Paired reads with one or both partners mapping to unannotated genomic regions were clustered based on overlapping alignments. (4) Clusters were filtered to remove singleton, stacked, and duplicate reads. (5) To determine a consensus pseudogene annotation, clusters were scanned through the Yale and ENCODE pseudogene databases as well as analyzed with a BLAT-based custom homology search. Data from individual samples were then compared to generate pseudogene expression signatures. Clusters not assigned at this stage were categorized as other potentially nonpseudogene transcripts. See also Figures S1, S2, and S3 and Tables S1 and S2.
Figure 2
Figure 2. Schematic Representation of Cluster Alignments with Pseudogene Transcripts
(A and B) The relative genomic structures of the parental genes are shown aligned to the respective pseudogenes, with their chromosomal locations indicated on the sides, (A) ATP8A2-Ψ and (B) CXADR-Ψ. The sequencing alterations distinguishing the pseudogene from the parental gene are indicated in red. The pseudogene transcripts are illustrated as black bars with red hatches, which indicate divergence from the parental sequence, and the length of the transcript in base pairs is shown on the side. These representations are then overlaid with schematics of paired-end reads used to form pseudogene clusters (in blue), followed by overlapping sequences in a zoomed-in region of the cluster. A comparative representation of the parental (WT) and pseudogene (Ψ) sequences for the specified region is shown on top. See also Figure S4.
Figure 3
Figure 3. Tissue/Lineage-Specific Pseudogene Expression Profiles
(A) Heatmap of pseudogene expression sorted on the basis of tissue-specific expression displays tissue-specific (top), tissue-enriched/nonspecific (middle), and ubiquitously expressed pseudogenes (bottom). (B) Zoomed-in version of the top panel displaying tissue-specific expressed pseudogenes. The columns represent different tissues, with the number of samples in parentheses. The rows represent individual clusters mapping to specific pseudogenes. The color intensity represents the frequency (%) of samples in a tissue type showing expression of a given pseudogenes (according to the scale indicated at the bottom). The key clusters are labeled with their corresponding parental gene symbols. MPN, myeloproliferative neoplasms. See also Table S6.
Figure 4
Figure 4. Cancer-Specific Pseudogene Expression Profiles
(A) Heatmap of pseudogene expression sorted according to cancer-specific expression patterns displays pseudogene transcripts specific to individual cancers (top), common across multiple cancers (tissue-enriched; middle), and nonspecific (bottom). (B) Zoomed-in version of the top panel displaying individual cancer-specific expressed pseudogenes. The columns represent different tissues with the number of samples in parentheses. The rows represent individual clusters mapping to specific pseudogenes. The color intensity represents the frequency (%) of samples in a tissue type showing expression of a given pseudogenes (according to the scale indicated at the bottom). The key clusters are labeled with their corresponding parental gene symbols. See also Figure S6 and Table S7.
Figure 5
Figure 5. Expression of CXADR-Ψ in Prostate Cancer
(A and B) Histogram of expression values (y axis) of CXADR-Ψ (A) and CXADR-WT (B) across a panel of tissue samples (x axis). The order of samples on the x axis is identical in both graphs to facilitate a visual comparison. (C) A summary histogram of the expression values of CXADR-Ψ and CXADR-WT in prostate cancers either harboring or lacking an ETS transcription factor gene fusion or in nonprostate samples. (D) Expression of CXADR-Ψ and CXADR-WT in matched pairs of tumor and benign samples from prostate cancer patients. The patients’ ETS status is indicated by the bar below. T, prostate cancer; B, matched benign adjacent prostate. The expression values were normalized against GAPDH. Error bars represent means ± SE of the mean. See also Figure S5.
Figure 6
Figure 6. Expression of ATP8A2-Ψ in Breast Cancer
(A and B) Histogram of expression values (y axis) of ATP8A2-Ψ (A) and ATP8A2-WT (B) across a panel of tissue samples (x axis). The order of samples on the x axis is identical in both graphs to facilitate a visual comparison. (Inset) A summary histogram of the expression values of ATP8A2-Ψ and ATP8A2-WT in breast cancer samples relative to benign breast and other tissues (left) and luminal versus basal breast cancer subtypes (right). The expression values were normalized against GAPDH. (C) Cell proliferation assays following siRNA knockdowns of ATP8A2-WT and -Ψ as indicated. NTC, nontargeting control; WT, siRNA against wild-type ATP8A2; Ψ, siRNA against ATP8A2-Ψ. (D) Boyden chamber assay showing cell migration (left) and invasion through matrigel (right). (E and F) (E) The effect of ATP8A2-Ψ overexpression in TERT-HMEC cells on cell proliferation (left) and cell migration based on Incucyte wound confluency assay (right) and (F) chicken chorioallantoic membrane assay of HCC-1806 cells treated with nontargeting control siRNA, ATP8A2-WT, or ATPA2-Ψ siRNA showing relative number of cells intravasated in the lower CAM (left) and metastatic cells in chicken lung (right). Error bars represent means ± SE of the mean.

Comment in

  • The great pretenders.
    McCarthy N. McCarthy N. Nat Rev Cancer. 2012 Jul 12;12(8):506. doi: 10.1038/nrc3326. Nat Rev Cancer. 2012. PMID: 22785353 No abstract available.

References

    1. Bier A, Oviedo-Landaverde I, Zhao J, Mamane Y, Kandouz M, Batist G. Connexin43 pseudogene in breast cancer cells offers a novel therapeutic target. Mol Cancer Ther. 2009;8:786–793. - PubMed
    1. Cesana M, Cacchiarelli D, Legnini I, Santini T, Sthandier O, Chinappi M, Tramontano A, Bozzoni I. A long noncoding RNA controls muscle differentiation by functioning as a competing endogenous RNA. Cell. 2011;147:358–369. - PMC - PubMed
    1. Dormeyer W, van Hoof D, Braam SR, Heck AJ, Mummery CL, Krijgsveld J. Plasma membrane proteomics of human embryonic stem cells and human embryonal carcinoma cells. J Proteome Res. 2008;7:2936–2951. - PubMed
    1. Gang L, Janecka JE, Murphy WJ. Accelerated evolution of CES7, a gene encoding a novel major urinary protein in the Cat family. Mol Biol Evol. 2011;28:911–920. - PubMed
    1. Han H, Nutiu R, Moffat J, Blencowe BJ. SnapShot: High-throughput sequencing applications. Cell. 2011a;146:1044. - PubMed

Publication types