. 2012 Jun 21;74(6):1087-98.
doi: 10.1016/j.neuron.2012.04.021.

Odor representations in olfactory cortex: distributed rate coding and decorrelated population activity

Affiliations

Odor representations in olfactory cortex: distributed rate coding and decorrelated population activity

Keiji Miura et al. Neuron. .

Abstract

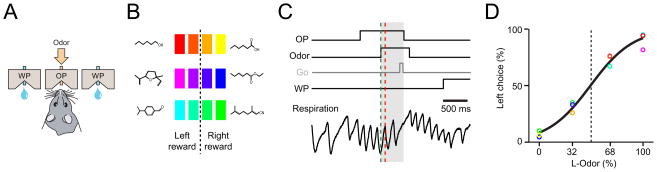
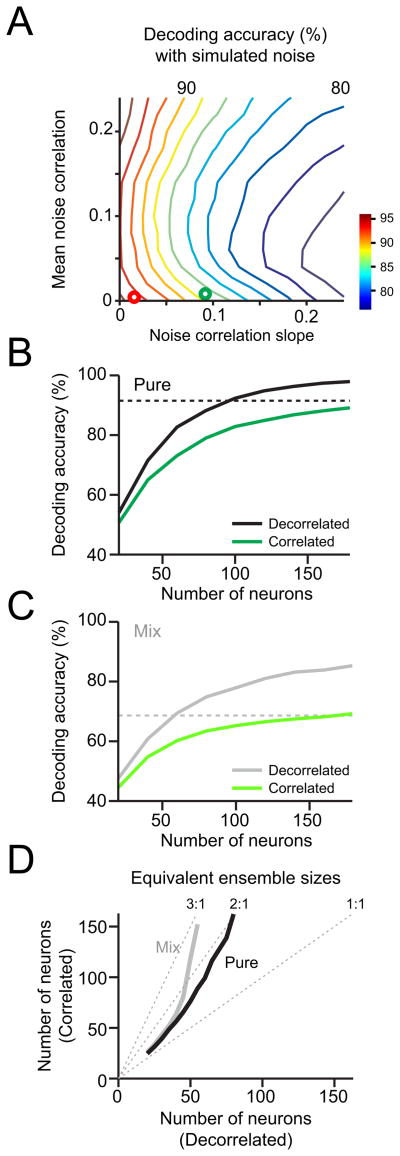
How information encoded in neuronal spike trains is used to guide sensory decisions is a fundamental question. In olfaction, a single sniff is sufficient for fine odor discrimination but the neural representations on which olfactory decisions are based are unclear. Here, we recorded neural ensemble activity in the anterior piriform cortex (aPC) of rats performing an odor mixture categorization task. We show that odors evoke transient bursts locked to sniff onset and that odor identity can be better decoded using burst spike counts than by spike latencies or temporal patterns. Surprisingly, aPC ensembles also exhibited near-zero noise correlations during odor stimulation. Consequently, fewer than 100 aPC neurons provided sufficient information to account for behavioral speed and accuracy, suggesting that behavioral performance limits arise downstream of aPC. These findings demonstrate profound transformations in the dynamics of odor representations from the olfactory bulb to cortex and reveal likely substrates for odor-guided decisions.


Figures

Figure 1
Figure 1. Behavioral performance and sniff-locked burst responses of aPC neurons
(A, B) Schematic of odor mixture categorization task. Rats were trained to respond to the left or right reward port depending on the dominant component in a mixture. Task difficulty was varied by changing ratios of two odorants of a given odor pair (A/B: 0/100, 32/68, 68/32, 100/0). Three pairs of odors were used and all the stimuli were randomly interleaved in a session. Odors are indicated by colors; yellow: caproic acid, red: 1-hexanol, blue: ethyl 3-hexenoate, magenta: dehydroxy linalool oxide, green: citralva, cyan: cumin aldehyde. Intermediate colors represent binary mixtures of the pure odors. (C) Task timing and Respiration patterns. An odor was delivered in the odor port upon entry with a pseudorandom delay of 0.2–0.5 s. In a self-paced version of the task (reaction time paradigm, blank line), rats were allowed to respond as soon as they decided to leave the port. In the go-signal paradigm, rats had to wait until a tone (go-signal, grey line) is played 700 ms after odor onset. Respiration patterns were monitored using a temperature sensor in the nasal cavity (the voltage signal from a nasal thermocouple: V). The gray shading indicates the timing of odor sampling. Scale bar: 500 ms. (D) Psychometric curve. The behavioral performance for the 12 odors (same color code as a) were fitted by a sigmoid curve as a function of mixture ratio. Task performance accuracy was higher for pure compared to mixture stimuli.
Figure 2
Figure 2. Sniffing of odors triggers transient spike bursts tightly locked to inhalation onset
(A, B) Activity of an example aPC neuron. Raster plots represent neural activity with each row corresponding to a single trial (N = 37 trials) and each tick mark to a spike. Peri-event histograms are overlaid (green and red, smoothed with a Gaussian filter with the standard deviation of 7.5 ms). Trials are aligned to onset of odor valve opening (A) or first sniff after odor valve opening (B). In (B), periodic spontaneous activity before t=0 that reflects sniffing is evident. (C) Comparison of peak firing rates between the two alignment conditions (odor valve opening vs. first sniff onset). Instantaneous firing rates were calculated after smoothing the peri-event histogram using a Gaussian filter (S.D.: 7.5 ms). The arrow denotes the example in this figure (A, B). A baseline firing rate (0 to 0.5 sec before odor valve onset) was subtracted for each neuron-odor pair. The peak firing rates are higher when triggered by the first inhalation onset (P<10−10, Wilcoxon signed rank test). (D) Histogram of temporal half width of peak firing. Data from 243 odor-responsive neurons. (E) Histogram of peak timing. Same data as in D.
Figure 3
Figure 3. Moderately sparse, distributed population odor responses in aPC
(A) Odor-evoked responses of an example neuron during first sniff cycle after odor onset. The bottom colors indicate odors tested (same colors as in Figure 1B). The middle plot shows the firing rates in first sniff after odor valve opening (40–160 ms from inhalation onset) as a function of odor stimuli. The dashed line indicates the firing rate at the pre-odor sniff. The top colors indicate the magnitude of odor response to each stimulus. The response magnitudes were calculated as a comparison with blank (no odor) trials using the signal detection analysis (area under the receiver operating characteristics curve, auROC, see Experimental Procedures). Scale is shown in c(red: excitatory response with perfect discriminability, black: no discriminability (no response), blue: inhibitory response with perfect discriminability). (B) Statistical analysis of neural activity during first sniff (40–160 ms window from sniff onset) (3-way ANOVA performed for each neuron with factors of stimulus identity, choice direction and reward outcome, P < 0.05). Neural responses during this period mostly reflect odor stimuli but not behavioral choice or reward outcomes. (C) Summary of odor responses (179 neurons). Odor response magnitudes were indicated as in A, top (also see color scale). Non-significant responses (P >0.05, Wilcoxon rank sum test) were black colored. The example neuron in A is indicated by the arrow. Neurons are sorted by pre-odor firing rates in an increasing order. (D) Histogram of number of pure odorants that activated a given neuron (P < 0.05, Wilcoxon rank sum test). Two lines represent binomial fits with (purple; non-responsive p0=0.50, the other neuron respond with p=0.16/(1−p0)=0.33) or without allowance of extra non-responsive neurons (orange; p=0.16). As a population, 45% of aPC neurons were activated by at least one of the six odors tested while 28% were activated by two or more (<0.05, Wilcoxon rank sum test).
Figure 4
Figure 4. Rapid and accurate readout of odor information based on spike counts in first sniff
(A) Activity of an example neuron in response to two different odors. This neuron responded to the two odors with different temporal profiles. (B) Trial-to-trial relationship of peak timing and total spike counts (same neuron and odors as in A). Each dot corresponds to one trial. The peak timing is defined as the timing when the smoothed firing rate profile reaches the maximum firing rate within the first sniff cycle. (C, D) Correlation coefficients between spike counts and peak timing (C) and latency (D) for 908 neuron-odor pairs. Black bars indicate significant correlations (P < 0.05). (E) Odor decoding accuracy of a linear decoder based on different firing features. Information contained in an ensemble neural activity (179 neurons) in a sniff (40–160 ms from inhalation onset) was quantified by the accuracy with which a linear classifier (support vector machine with a linear kernel) can correctly identify stimulus out of six odors in a trial-by-trial basis (see Full Experimental Procedures). Decoding accuracy for six pure odors (black) and six mix odors (gray) are plotted separately. Latency: timing of first spike. Peak: timing of peak firing rate. Count: total spike count. L&C: latency and spike count. P&C: peak time and spike count. (F) Odor decoding accuracy with increasing window lengths. Decoding using peak timing does not result in any faster performance than that using only spike counts. A total of 179 neurons are used. The chance performance level is 16.67% (= 1/6, horizontal thin line). Black horizontal dashed lines indicate the behavioral performance levels for pure odors. (G) Odor decoding accuracy of a linear classifier, plotted as a function of bin size (10 ms to 160 ms, i.e., temporal resolution). A 160ms time window after the first sniff was first equipartitioned into smaller sized bins (80, 40, 20 or 10ms, respectively) and then the spike counts in all the bins were used for classification. Black: pure, grey: mixture stimuli. Black and gray horizontal dashed lines indicate the behavioral performance levels for pure and mix odors, respectively. (H) Odor decoding accuracy based on spike counts and phases for pure and mixture odor trials. Spike time: spike counts in 160ms × 1 bin. Phase: spike counts in 8 bins equipartitioning the first sniff cycle. Note that bin widths vary by trials in Phase. For fair comparisons, decoding accuracy was plotted against the mean number of spikes per trial instead of the number of neurons.
Figure 5
Figure 5. Information conveyed by the spike counts provide in the burst activity can account for the speed and accuracy of odor discrimination
(A) Decoding accuracy as a function of the number of neurons. Total spike counts within 40–160 ms after the first sniff onset were used. (B) Time course of odor decoding accuracy. A vector consisting of instantaneous spike counts of 179 neurons in a sliding window (width: 50 ms, step: 5 ms) was used for the input to a classifier. Training of a classifier and testing were done at every time point. Black: pure, grey: mixture stimuli. (C) Time course of odor decoding accuracy after the second sniff onset. (D) Odor decoding accuracy at different sniff cycles. 1: first sniff, 2: second sniff, L: last sniff before odor port exit. +: sum of the spike counts from 1st and 2nd sniffs. &: spike counts from the 1st and 2nd sniffs are treated as independent inputs to a classifier. Note that the last sniffs contain 1st or 2nd sniff depending on how many sniff the animal took in a given trial. The neural response at the first sniff is more informative than the second and the last sniffs. Combining 1st and 2nd sniffs improved decoding accuracy only a little (statistically not significant either for pure or mixture odors, P>0.05, χ2 test). (E) Comparison of the responses of an example neuron to the same odor on correct trials and error trials. (F) Choice probabilities: correlations between a trial-to-trial variability in neural activity and a choice toward neuron’s preferred direction. Only mixture odor trials were used to get significant number of error trials. The fraction neurons with significant choice probabilities > 0.5 is significantly larger than the fraction with significant choice probabilities < 0.5 (P < 0.05, χ2 test) although the mean choice probability was not significantly larger than 0.5 (Wilcoxon sign rank test, P > 0.5). A neuron’s preferred choice direction was determined as a direction for a pure odor with significantly higher firing rate than the paired pure odor. Only neuron-mixture odor pairs where two pure odors showed significantly different responses (area under receiver operating characteristic curve > 0.7 or < 0.3) and with numbers of trials for each choice more than five were used for the analysis. (G–I) Odor decoding accuracy for correct and error trials using simultaneously recorded ensemble neurons (n=19 sessions). Total spike counts within 40–160 ms (F), Peak time (G) and latency (H) from the first sniff onset were used. Only trials with mixture odors, where most of error trials are available, were used. A classifier was first trained using correct trials, and decoding accuracy was obtained using test trials that are composed of correct or error trials. P < 0.05 for spike counts (Wilcoxon test).
Figure 6
Figure 6. Near zero noise correlations in aPC
(A) Histogram of noise correlations. Noise correlations were calculated using spike counts in the first sniff cycle after odor onset (40–160 ms). A similar distribution of noise correlations was obtained after trial-shuffling (magenta), indicating that most neuron pairs had zero noise correlations. Black bars indicate correlations significantly different from zero (P < 0.05). (B) Signal correlations (similarity in odor response tuning for a pair of neurons) compared between neuron pairs from same (S) and different (D) electrodes. Neuron pairs from same electrode showed slightly higher signal correlations (P > 0.05, Wilcoxon rank sum test). The error bars are S.E.M. across neuron-odor pairs. (C) Noise correlations compared between neuron pairs from same and different electrodes. There was no difference in noise correlations (P > 0.05, Wilcoxon rank sum test). The error bars are SEM across neuron-odor pairs. (D) No dependency between noise correlations and signal correlations. Neuron pairs recorded from same (S) and different (D) electrodes are indicated by blank and orange dots, respectively. A dot represents a neuron pair. Neither the slope nor intercept of the regression lines were significantly different from 0 (red and black lines, P > 0.05, linear regression), indicating no relationship between noise correlations and signal correlations.
Figure 7
Figure 7. Odor stimulation quenches structured trial-to-trial correlations that emerge during pre-odor sniffing
(A) Mean firing rate over the population as a function of task epochs. Spikes in the first sniff after each task event were used. Pre-odor port: 500 ms before odor port in. The bar with a star indicates significance between two epochs and a star without a horizontal bar indicates the significance against all the other epochs (the error bars are across neuron-odor pairs, ANOVA with LSD method). (B) Mean correlation as a function of task epochs. The error bars are for neuron-odor pairs. (C) Regression slopes for the signal correlation and trial-to-trial correlation relationship (D) as a function of task epochs. Trial-to-trial correlations were computed at each epoch while signal correlations were computed at the first sniff (generalized linear model with Holm method). The error bars are SEM across neuron-odor pairs. (D) Trial-to-trial correlations as a function of signal correlations. Two task epochs, pre-odor (green) and 1st sniff (red), are plotted separately (P < 0.05 for slopes, generalized linear model). The error bars are SEM across neuron-odor pairs.
Figure 8
Figure 8. Odor decoding accuracy in the presence of simulated noise correlation structures
(A) To simulate odor evoked activity that has an arbitorary noise correlation structure, trials were shuffled to artificially induce the mean and slope of the noise and signal correlation relationship. Shuffling was performed multiple times toward minimizing the least square error to achieve the target noise correlation structures defined by its intercept and slope. Odor decoding accuracy was then computed using the trial-shuffled ensemble activity. The green and red circles indicate pre-odor and 1st sniff, respectively. (B, C) Decoding accuracy using decorrelated (black, gray) and correlated ensembles (green, light green) as a function of number of neurons. Pure (B) and mixture (C) odors were plotted separately. The mean and slope of the correlations observed during the pre-odor period were used to simulate correlated ensembles. The dashed lines denote the animals’ behavioral performance for each condition. The decorrelated ensemble results are the same as in Figure 5A. (D) Equivalent ensample sizes. The number of neurons required to achieve the same decoding accuracy between decorrelated and correlated ensembles were obtained from B and C. The dotted lines represent ratios (3:1, 2:1, 1:1) of the numbers of neurons between decorrelated vs. correlated ensembles. As the size of a population increases, disproportionately more neurons are required to achieve the same performance in the presence of structured noise correlations.

References

    1. Averbeck BB, Latham PE, Pouget A. Neural correlations, population coding and computation. Nat Rev Neurosci. 2006;7:358–366. - PubMed
    1. Bair W, Zohary E, Newsome WT. Correlated firing in macaque visual area MT: time scales and relationship to behavior. J Neurosci. 2001;21:1676–1697. - PMC - PubMed
    1. Bhandawat V, Olsen SR, Gouwens NW, Schlief ML, Wilson RI. Sensory processing in the Drosophila antennal lobe increases reliability and separability of ensemble odor representations. Nat Neurosci. 2007;10:1474–1482. - PMC - PubMed
    1. Blumhagen F, Zhu P, Shum J, Scharer YP, Yaksi E, Deisseroth K, Friedrich RW. Neuronal filtering of multiplexed odour representations. Nature. 2011;479:493–498. - PubMed
    1. Britten KH, Newsome WT, Shadlen MN, Celebrini S, Movshon JA. A relationship between behavioral choice and the visual responses of neurons in macaque MT. Vis Neurosci. 1996;13:87–100. - PubMed

Publication types