. 2012 Jul 13;91(1):38-55.
doi: 10.1016/j.ajhg.2012.05.011. Epub 2012 Jun 21.

Genome-wide transcriptome profiling reveals the functional impact of rare de novo and recurrent CNVs in autism spectrum disorders

Affiliations

Genome-wide transcriptome profiling reveals the functional impact of rare de novo and recurrent CNVs in autism spectrum disorders

Rui Luo et al. Am J Hum Genet. .

Abstract

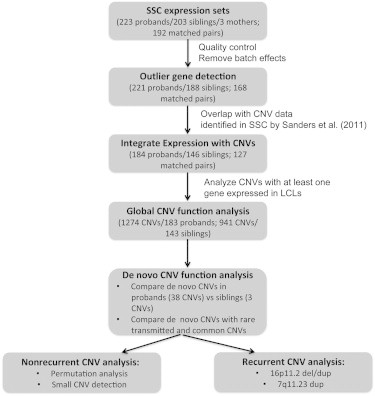
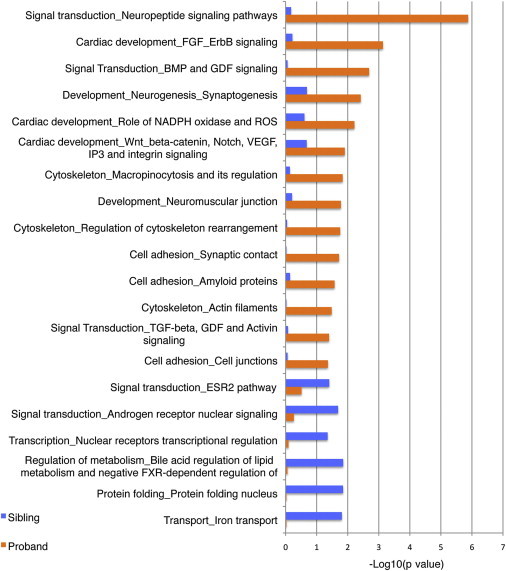
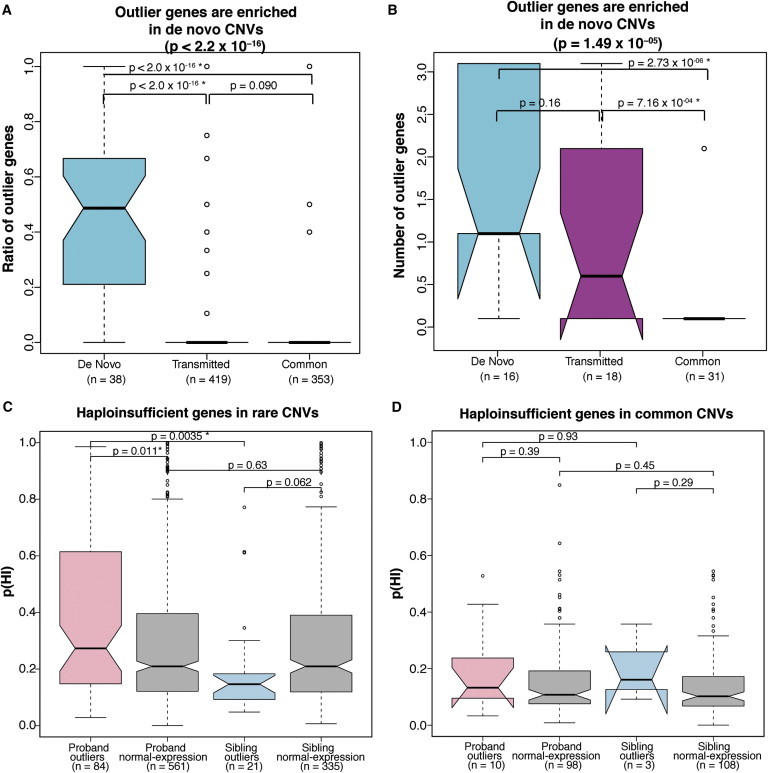
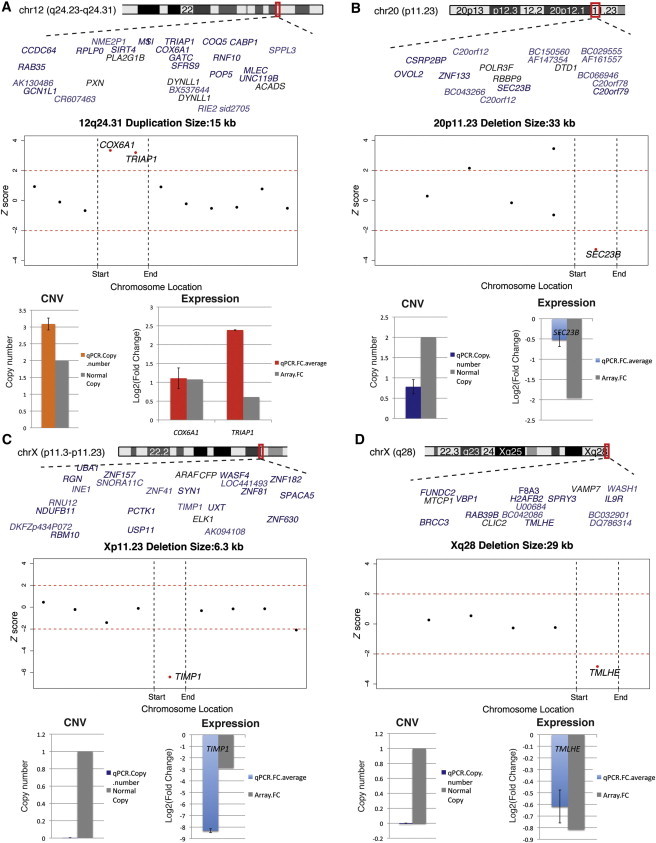
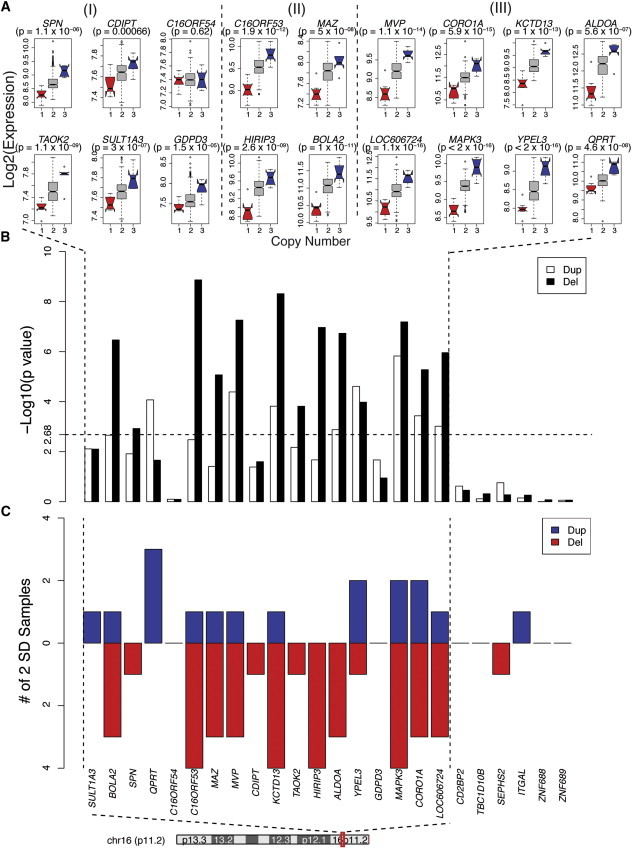
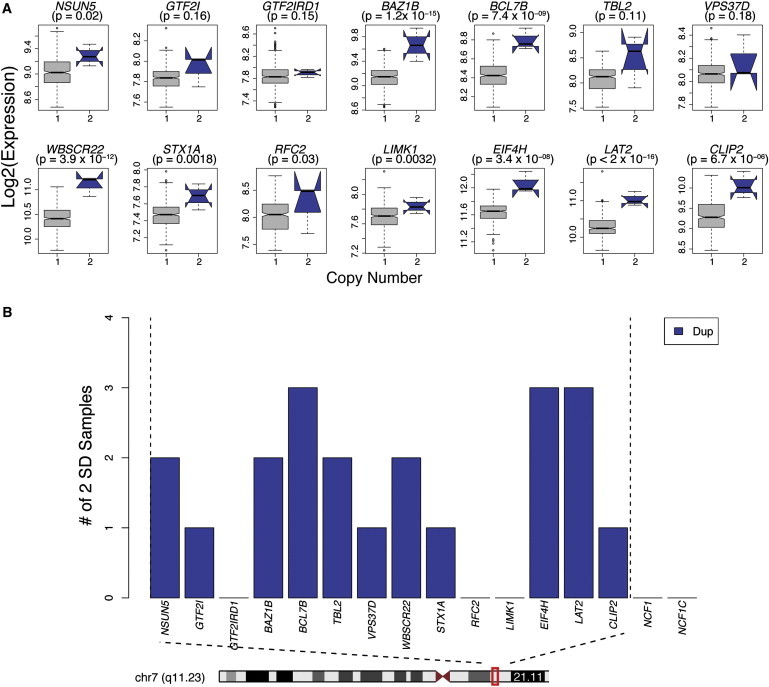
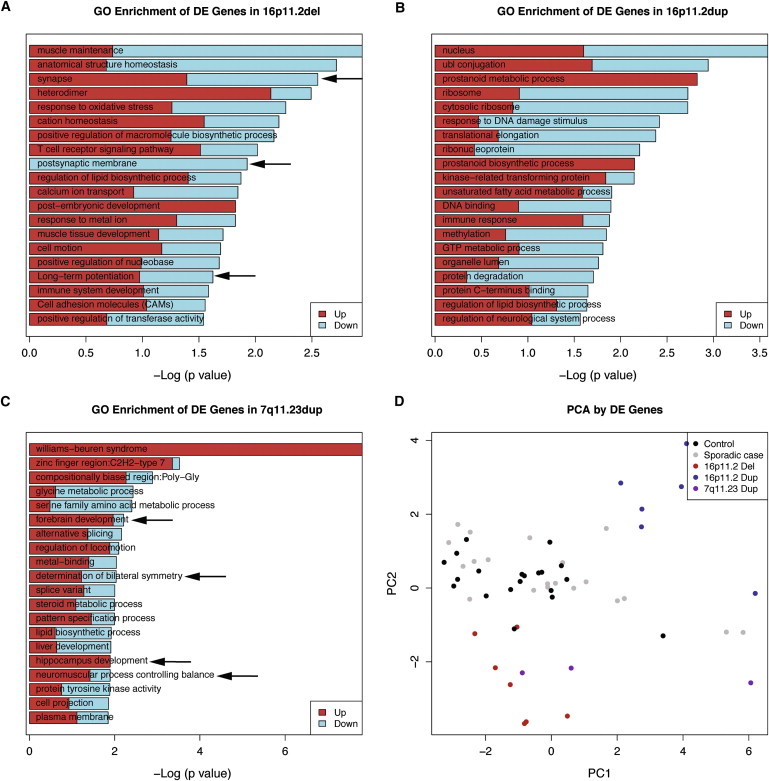
Copy-number variants (CNVs) are a major contributor to the pathophysiology of autism spectrum disorders (ASDs), but the functional impact of CNVs remains largely unexplored. Because brain tissue is not available from most samples, we interrogated gene expression in lymphoblasts from 244 families with discordant siblings in the Simons Simplex Collection in order to identify potentially pathogenic variation. Our results reveal that the overall frequency of significantly misexpressed genes (which we refer to here as outliers) identified in probands and unaffected siblings does not differ. However, in probands, but not their unaffected siblings, the group of outlier genes is significantly enriched in neural-related pathways, including neuropeptide signaling, synaptogenesis, and cell adhesion. We demonstrate that outlier genes cluster within the most pathogenic CNVs (rare de novo CNVs) and can be used for the prioritization of rare CNVs of potentially unknown significance. Several nonrecurrent CNVs with significant gene-expression alterations are identified (these include deletions in chromosomal regions 3q27, 3p13, and 3p26 and duplications at 2p15), suggesting that these are potential candidate ASD loci. In addition, we identify distinct expression changes in 16p11.2 microdeletions, 16p11.2 microduplications, and 7q11.23 duplications, and we show that specific genes within the 16p CNV interval correlate with differences in head circumference, an ASD-relevant phenotype. This study provides evidence that pathogenic structural variants have a functional impact via transcriptome alterations in ASDs at a genome-wide level and demonstrates the utility of integrating gene expression with mutation data for the prioritization of genes disrupted by potentially pathogenic mutations.


Figures

Figure 1
Figure 1
Flow Chart of Expression-Data Analysis and Integration with CNV Data in the SSC Quality control was done before any data analysis (Figure S1, Material and Methods). The numbers of individuals and CNVs used for downstream analysis are shown in the flow chart.
Figure 2
Figure 2
Neural-Related Pathways Are Enriched in Probands versus Siblings GeneGo was used for the ontology analysis for outlier genes identified in probands and siblings. The –log10 p value is shown with the pathways that were significant (with uncorrected p value < 0.05) in either probands or siblings.
Figure 3
Figure 3
Outlier Genes Are Enriched in Rare De Novo CNVs in Probands (A) The box plot depicts the ratio of dysregulated genes (the number of dysregulated genes within a CNV versus the total number of genes within that CNV) in each of the three types of CNVs (rare de novo CNVs, rare transmitted CNVs, and common CNVs). The Krusakal-Wallis test p value is shown. (B) The box plot shows the number of dysregulated genes in three types of CNVs with matched gene number. (C) The box plot compares haploinsufficiency (HI) scores of downregulated genes (2 SDs) in rare deletions in probands and siblings with those of normally expressed genes within CNVs. The HI score of dysregulated genes in rare deletions in probands is significantly higher than that of the normally expressed genes, whereas the HI score of dysregulated genes in rare deletions in siblings is significantly lower than that of the normally expressed genes (Mann Whitney U test). (D) The box plot compares HI scores of downregulated genes (2 SDs) in common deletions in probands and siblings with those of normally expressed genes within CNVs. The Mann Whitney U test p value is shown for each pairwise comparison. A star indicates a statistically significant p value after Bonferroni correction (p < 0.017 in A and B; p < 0.0125 in C and D). Error bars for these four panels are defined as 1.5× the interquartile range.
Figure 4
Figure 4
Outlier Genes Highlight Small but Likely Functional CNVs (A) A small duplication with a high ratio of dysregulated genes. (B, C, and D) Small deletions with high ratios of dysregulated genes. The Z scores of all expressed genes within the CNV interval and within 500 kb upstream and downstream are shown. Outlier genes (2 SDs; red) within the CNVs are shown. A bar plot shows the qPCR validation for both copy-number change and the expression alteration. Error bars represent the SD of three replicates of qPCR experiments.
Figure 5
Figure 5
Gene Expression in the 16p11.2 Duplication and Deletion Interval (A) For each of the expressed genes within the 16p11.2 interval, the log2 expression level is shown for deletions (red), duplications (blue), and controls (gray). The p value was calculated with a multivariable linear-regression model with 16p11.2 cases and 398 controls without a known 16p11.2 event (Material and Methods). Twelve out of 19 expressed genes in deletions have at least a 1.3-fold change measured by microarray, whereas 8 out of 19 genes in duplications show a 1.3-fold or greater change. Group I represents genes that don't reach 1.3-fold change in either duplications or deletions; group II represents genes that have greater than 1.3-fold change in deletions only; and group III represents genes that have greater than 1.3-fold change in both duplications and deletions (dash lines separate the three groups). Error bars are defined as 1.5× the interquartile range. (B) The –log10 of the p value (t test) for duplications and deletions is shown on the y axis for each gene within the 16p11.2 region and within 500 kb upstream and downstream. The dashed vertical lines show the p value threshold after Bonferroni correction (corrected for 24 genes, p value < 2.1 × 10−3). (C) Genes showing expression deviating by at least 2 SDs from the mean across 13 samples (seven deletions and six duplications) with 16p11.2 CNVs.
Figure 6
Figure 6
Gene Expression in the 7q11.23 Interval (A) For each of the expressed genes within the 7q11.23 interval, the log2 expression level is shown for duplications (blue) and controls (gray). The p value was calculated with a multivariate linear regression with 7q11.23-duplication cases and 411 controls without a known 7q11.23 event (Material and Methods). Error bars are defined as 1.5× the interquartile range. (B) Genes showing expression deviating by at least 2 SDs from the mean across three samples with 7q11.23 duplications.
Figure 7
Figure 7
GO Enrichment Analysis and PCA Highlight Distinct Molecular Pathways in 16p11.2 Duplications and Deletions (A) GO enrichment analysis of the 307 genes (p < 0.05) showing altered expression in deletions (DAVID). The –log10 of the uncorrected p value is shown in (A)–(C). (B) GO enrichment analysis of the 698 genes (p < 0.05) showing altered expression in duplications (DAVID). (C) GO enrichment of the 439 genes (p < 0.05) showing altered expression in 7q11.23 duplications (DAVID). (D) Scatter plot of the first two components of 16p11.2 cases, 7q11.23 cases, sporadic-autism cases, and controls. Samples are clustered on the basis of PCA. Seven 16p11.2-deletion probands (red), six 16p11.2-duplication probands (green), and three 7q11.23-duplication (purple) probands were included. As a comparison group, 20 randomly selected sporadic-autism probands (blue) and 20 randomly selected controls (black) were included. The first two principle components were used for the formation of a two-dimensional space. The merged list of DEX genes (p < 0.01) in 16p11.2 duplications, 16p11.2 deletions, and 7q11.23 duplications was utilized for PCA.

References

    1. Geschwind D.H. Advances in autism. Annu. Rev. Med. 2009;60:367–380. - PMC - PubMed
    1. Miles J.H. Autism spectrum disorders—a genetics review. Genet. Med. 2011;13:278–294. - PubMed
    1. Jorde L.B., Hasstedt S.J., Ritvo E.R., Mason-Brothers A., Freeman B.J., Pingree C., McMahon W.M., Petersen B., Jenson W.R., Mo A. Complex segregation analysis of autism. Am. J. Hum. Genet. 1991;49:932–938. - PMC - PubMed
    1. Bolton P.F., Pickles A., Murphy M., Rutter M. Autism, affective and other psychiatric disorders: Patterns of familial aggregation. Psychol. Med. 1998;28:385–395. - PubMed
    1. Ronald A., Hoekstra R.A. Autism spectrum disorders and autistic traits: A decade of new twin studies. Am. J. Med. Genet. B. Neuropsychiatr. Genet. 2011;156B:255–274. - PubMed

Publication types