. 2012 Jul 17;23(1):181-92.
doi: 10.1016/j.devcel.2012.05.006. Epub 2012 Jun 21.

Doublecortin recognizes the 13-protofilament microtubule cooperatively and tracks microtubule ends

Affiliations

Doublecortin recognizes the 13-protofilament microtubule cooperatively and tracks microtubule ends

Susanne Bechstedt et al. Dev Cell. .

Abstract

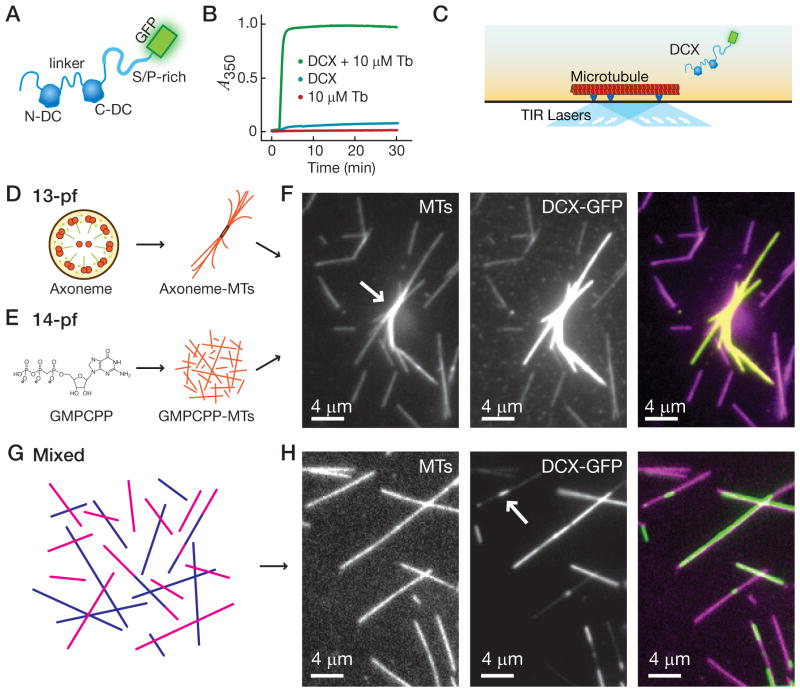
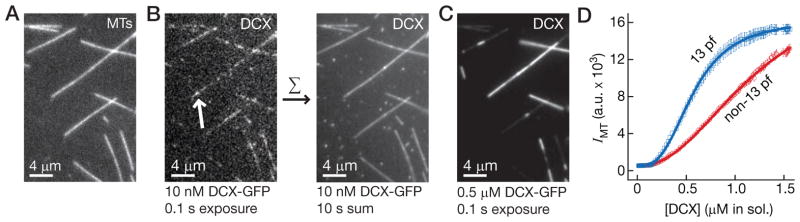
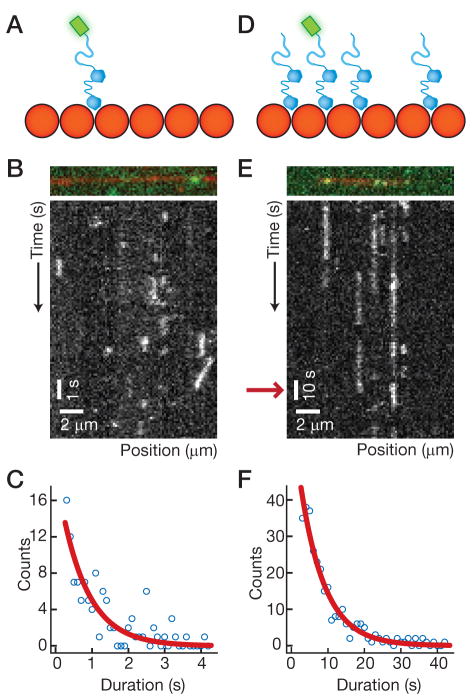
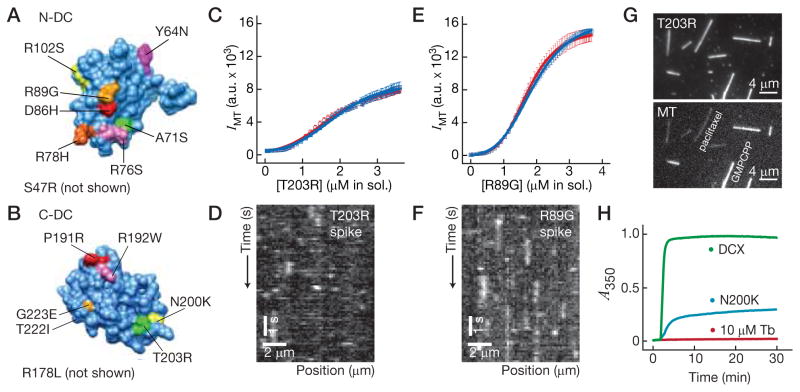
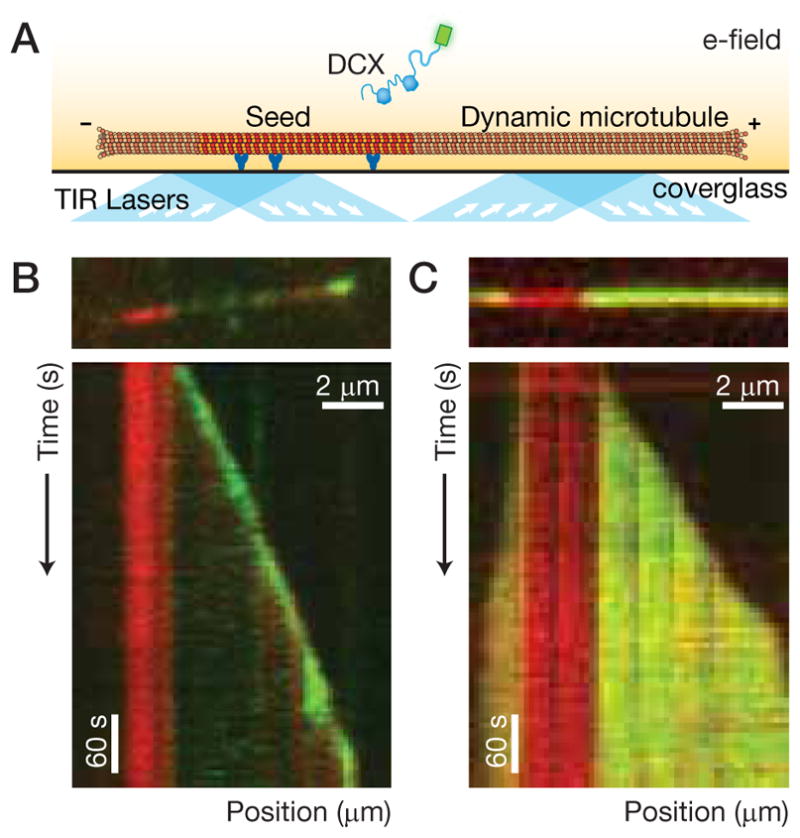
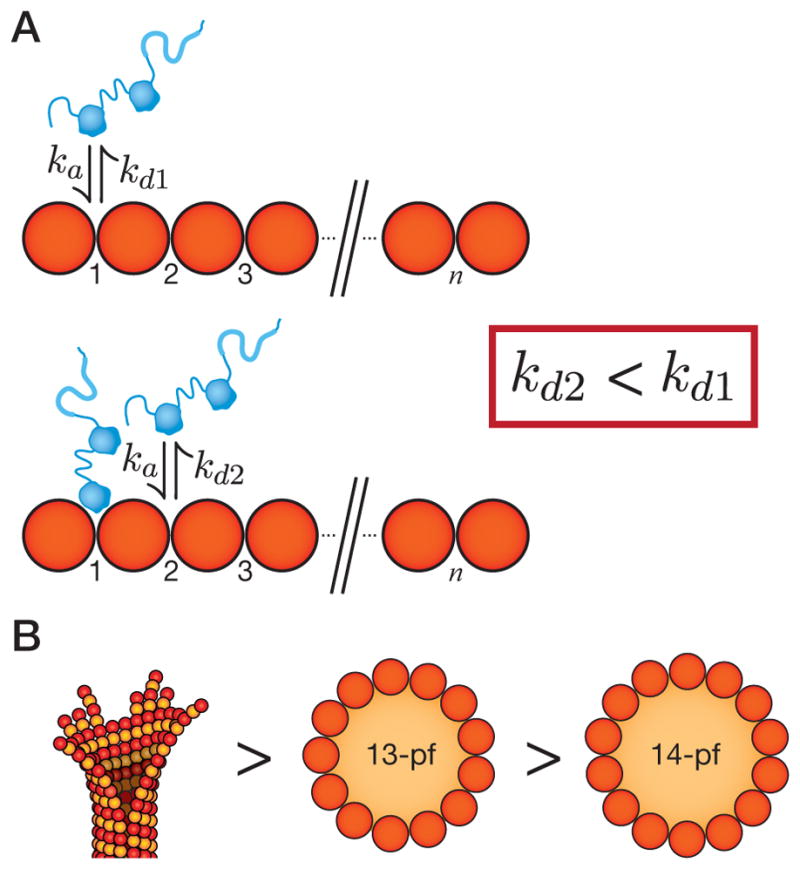
Neurons, like all cells, face the problem that tubulin forms microtubules with too many or too few protofilaments (pfs). Cells overcome this heterogeneity with the γ-tubulin ring complex, which provides a nucleation template for 13-pf microtubules. Doublecortin (DCX), a protein that stabilizes microtubules in developing neurons, also nucleates 13-pf microtubules in vitro. Using fluorescence microscopy assays, we show that the binding of DCX to microtubules is optimized for the lateral curvature of the 13-pf lattice. This sensitivity depends on a cooperative interaction wherein DCX molecules decrease the dissociation rate of their neighbors. Mutations in DCX found in patients with subcortical band heterotopia weaken these cooperative interactions. Using assays with dynamic microtubules, we discovered that DCX binds to polymerization intermediates at growing microtubule ends. These results support a mechanism for stabilizing 13-pf microtubules that allows DCX to template new 13-pf microtubules through associations with the sides of the microtubule lattice.


Figures

Figure 1
Figure 1. DCX preferentially binds 13-pf microtubules
(A) Schematic of DCX-GFP. The two DC-domains (labeled) are joined by a linker (labeled) and flanked by polypeptides. The C-terminal polypeptide is enriched in S/P residues (labeled). The GFP-tag is C-terminal. (B) Plot of absorbance at 350 nm versus time for tubulin alone (red), DCX-GFP alone (blue), and DCX-GFP with tubulin (green). DCX-GFP with tubulin produced a significant increase in absorbance, indicating microtubule formation. (C) Schematic of the single-molecule assay. (D) Schematic drawing of an axoneme (labeled), which nucleates axoneme-microtubules (MTs) with >90% 13-pf. (E) Chemical drawing of GMPCPP, which nucleates GMPCPP-MTs with >96% 14-pf. (F) Image of axoneme-nucleated microtubules (white arrow) and GMPCPP microtubules in the same microscope chamber (MTs); image of DCX-GFP exposed to these microtubules (DCX-GFP); color-combined image of axoneme-MTs, GMPCPP-MTs, and DCX-GFP. The DCX-GFP preferentially binds to the 13-pf axoneme MTs. (G) Schematic of a mixed population of MTs nucleated from purified tubulin. (H) Image of the mixed population of rhodamine-labeled microtubules (MTs); image of DCX-GFP exposed to this mixed population (DCX-GFP); color-combined image of MTs and DCX-GFP. Note that DCX-GFP binds preferentially to a subset of the mixed population, corresponding to the 13-pf subset, and that DCX-GFP binds to segments within individual microtubules (white arrow). See also Figure S1.
Figure 2
Figure 2. DCX undergoes a cooperative transition in microtubule binding
(A) Image of a mixed population of rhodamine-labeled microtubules. (B) Left, Image of 10 nM DCX-GFP exposed to a mixed population of microtubules taken with a 0.1 s camera exposure. Single DCX-GFP molecules were observed as diffraction-limited signals (white arrow). Right, Image of a 10 s summation (100 × 0.1 s frames) of DCX-GFP. No preference for 13-pf microtubules could be measured. (C) Image of 0.5 μM DCX-GFP exposed to the same microtubules as in (A), taken with a 0.1 s camera exposure. A clear preference for 13-pf microtubules is evident. (D) Plot of DCX-GFP intensity on the microtubules against the protein concentration in solution during titration of DCX-GFP into the microscope chamber. The bright, 13-pf microtubules (blue squares) were distinguished from the dimmer, non-13-pf microtubules (red circles). Error bars represent the SEM (n = 10). For curve-fitting, the data were fitted to the Hill equation, y = y0 + (ymaxy0) · xnH=(KnH + xnH) (lines plotted). See also Figure S2.
Figure 3
Figure 3. DCX decreases the dissociation rate of its neighbors
(A) Schematic of the single-molecule experiment. (B) Image from the single-molecule experiment (top) showing a single DCX-GFP (green) bound to a microtubule (red). Kymograph (bottom) depicting the association and dissociation of DCX-GFP to/from the microtubule. (C) Histogram of durations of DCX-GFP microtubule interactions. An exponential curve fit, corrected for photobleaching, yields a mean lifetime of interaction, 〈τ〉 = 0.9 s. (D) Schematic of the “spiking” experiment, in which unlabeled DCX is added to a low concentration of DCXGFP. (E) Image from the spiking experiment (top) showing a single DCX-GFP (green) bound to a microtubule (red). Kymograph (bottom) depicting the association and dissociation of DCX-GFP to/from the microtubule in the presence of unlabeled DCX. Note the difference in timescale (red arrow) compared to (B). (F) Histogram of durations of DCX-GFP microtubule interactions. An exponential curve fit, corrected for photobleaching, yields a mean lifetime of interaction, 〈τ〉 = 7.7 s.
Figure 4
Figure 4. Missense mutations found in human patients disrupt cooperative interactions
(A) Crystal structure of the N-DC domain (PDB: 2BQQ) showing the patient mutations used in this study. (B) Homology model of the C-DC domain based on the N-DC structure (Fourniol et al., 2010) showing the patient mutations used in this study. (C) Plot of T203R-DCX-GFP intensity on the microtubules against protein concentration in solution during titration of T203R-DCX-GFP into the microtubule chamber. The paclitaxel-MTs (blue) were plotted separately from the GMPCPP MTs (red). Error bars represent the SEM (n = 10). (D) Plot of R89G-DCX-GFP intensity on the microtubules against protein concentration in solution during titration of R89G-DCX-GFP into the microtubule chamber. The paclitaxel-MTs (blue) were plotted separately from the GMPCPP MTs (red). Error bars represent the SEM (n = 10). Data were fitted to the Hill equation (lines plotted). (E) Left, Image of two types of rhodamine-labeled MTs, dim paclitaxel-microtubules (labeled, mixed-pf number) and bright GMPCPP-MTs (labeled, 14-pf). Right, Image of T203R-DCX-GFP exposed to the two microtubule types. No preference for microtubule types was measured. (F) Plot of absorbance at 350 nm against time in the turbidity assay for wild-type DCX-GFP and T222I-DCX-GFP. See also Figure S3.
Figure 5
Figure 5. DCX tracks microtubule ends
(A) Schematic of the single-molecule dynamic assay. A dynamic microtubule (labeled) grows by extension of a GMPCPP-seed microtubule (labeled) adhered to a coverglass surface. (B) Image (top) and kymograph (bottom) depicting the interaction of 10 nM DCX-GFP with a dynamic microtubule. A bright DCX-GFP signal is observed to track the growing microtubule end. (C) Image (top) and kymograph (bottom) depicting the interaction of 100 nM DCX-GFP with a dynamic microtubule. A bright DCX-GFP signal is observed along the entire length of the microtubule extensions but the GMPCPP-seed microtubule is dimmer. See also Figure S5.
Figure 6
Figure 6. Model schematic for the mechanism of DCX
(A) The microtubule is depicted as an array of binding sites (numbered). DCX binds to microtubules in the groove between protofilaments, at the vertex of four tubulin dimers. In the absence of nearby molecules (top), DCX associates with an association rate constant, ka and dissociates with a dissociation rate constant, kd1. In the presence of nearby molecules (bottom), the dissociation rate constant falls (kd2 < kd1). (B) The affinity of DCX for microtubules is highest for microtubule end structures (left), intermediate for the 13-pf microtubule lattice (center), and lower for the 14-pf microtubule lattice (right).

Comment in

References

    1. Ashford A, Andersen S, Hyman AA. Preparation of Tubulin from Bovine Brain. In: Celis J, editor. Cell Biology, a Laboratory Handbook. Vol. 2. Academic Press; New York: 1998. pp. 205–212.
    1. Baas PW, Joshi HC. Gamma-tubulin distribution in the neuron: implications for the origins of neuritic microtubules. J Cell Biol. 1992;119(1):171–8. - PMC - PubMed
    1. Bai J, Ramos RL, Ackman JB, Thomas AM, Lee RV, LoTurco JJ. RNAi reveals doublecortin is required for radial migration in rat neocortex. Nat Neurosci. 2003;6(12):1277–83. - PubMed
    1. Bieling P, Laan L, Schek H, Munteanu EL, Sandblad L, Dogterom M, Brunner D, Surrey T. Reconstitution of a microtubule plus-end tracking system in vitro. Nature. 2007;450(7172):1100–5. - PubMed
    1. Bitinaite J, Rubino M, Varma KH, Schildkraut I, Vaisvila R, Vaiskunaite R. USER friendly DNA engineering and cloning method by uracil excision. Nucleic Acids Res. 2007;35(6):1992–2002. - PMC - PubMed

Publication types

MeSH terms